Global Nuclear Industry Performance
Global Highlights
Nuclear reactors generated a total of 2602 TWh of electricity in 2023, up 58 TWh from 2544 TWh in 2022, but still down 51 TWh on the 2653 TWh generated in 2021. A key contributor to the recovery in 2023 was the 42 TWh increase in generation in France, recovering around half of the reduction in output that was caused by extended outages the previous year.
Figure 1. Global nuclear electricity production
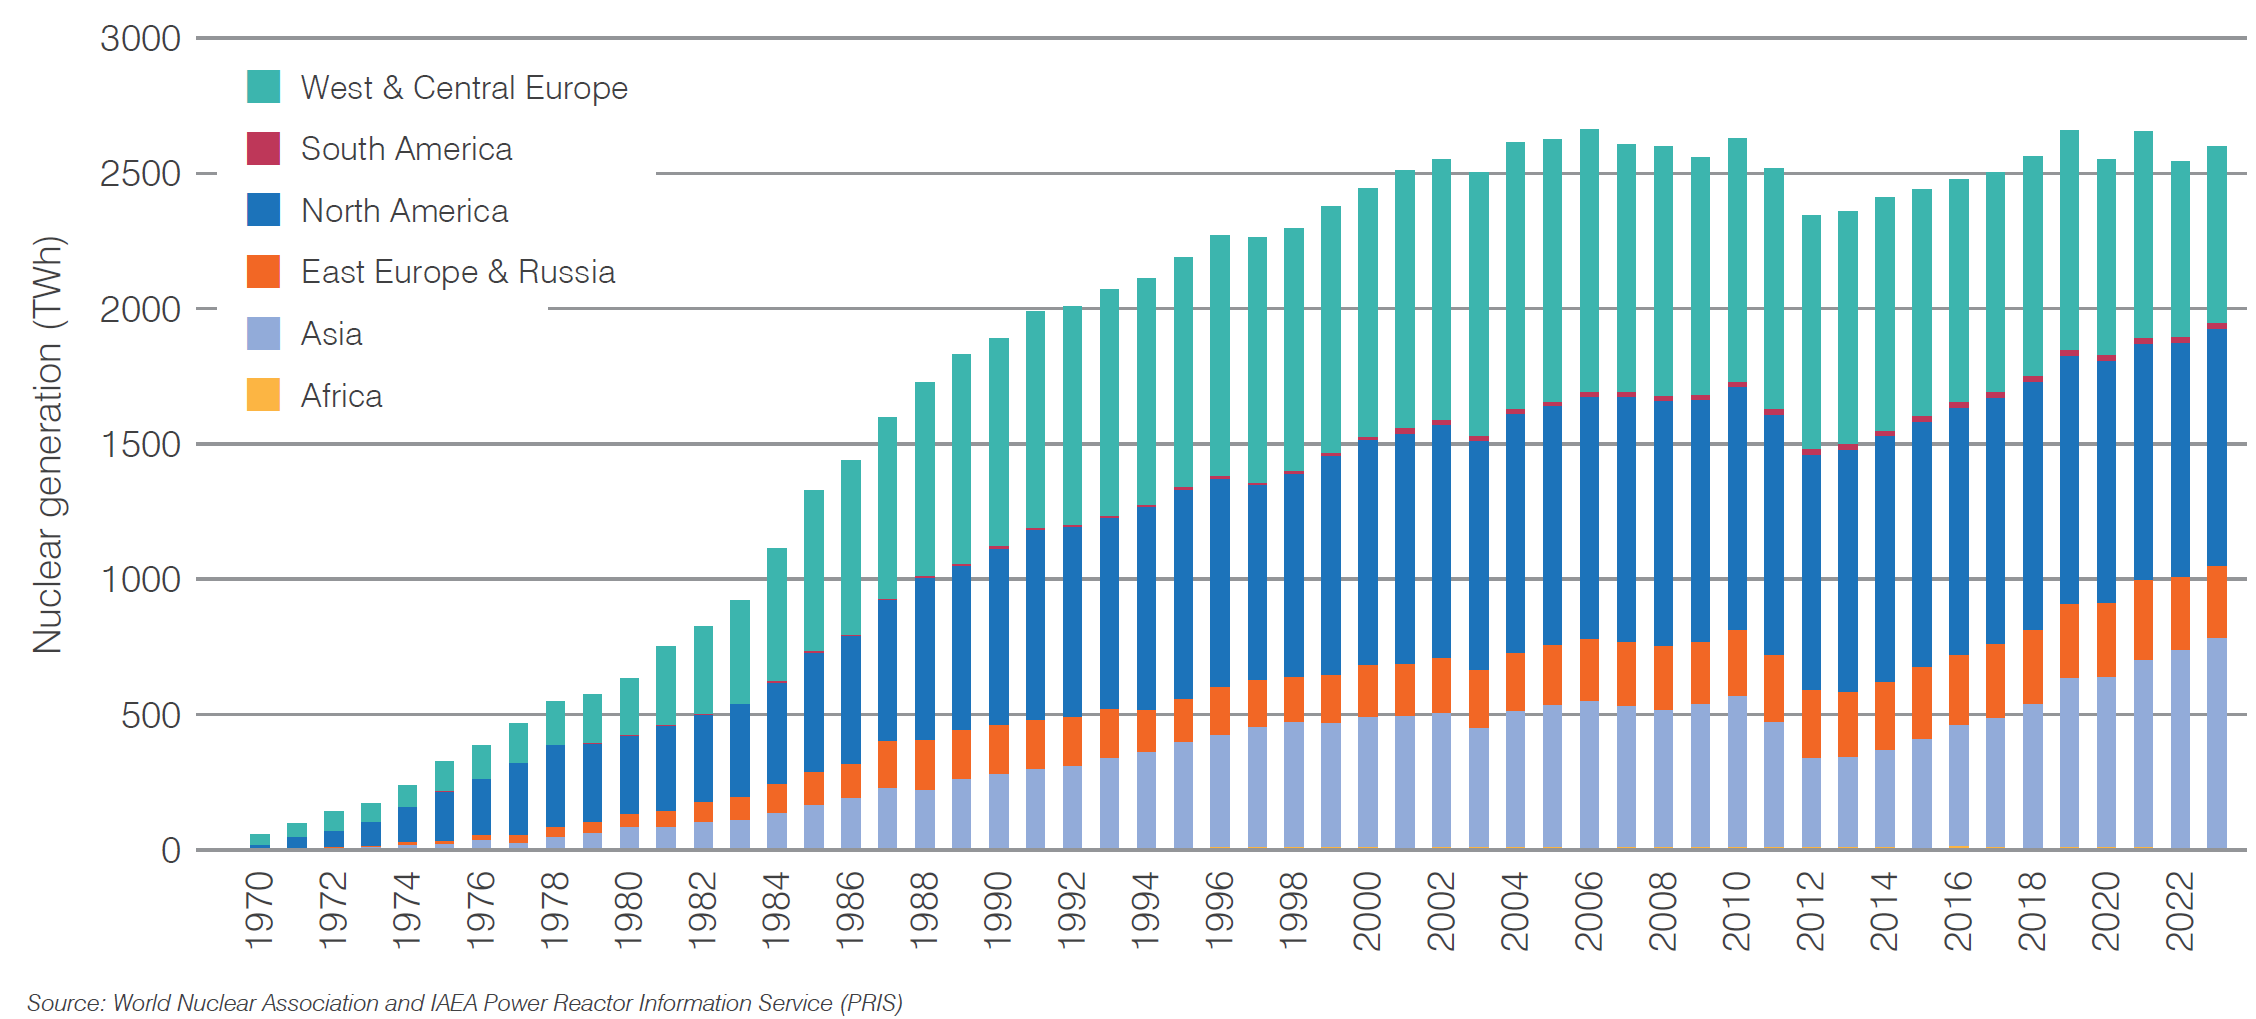
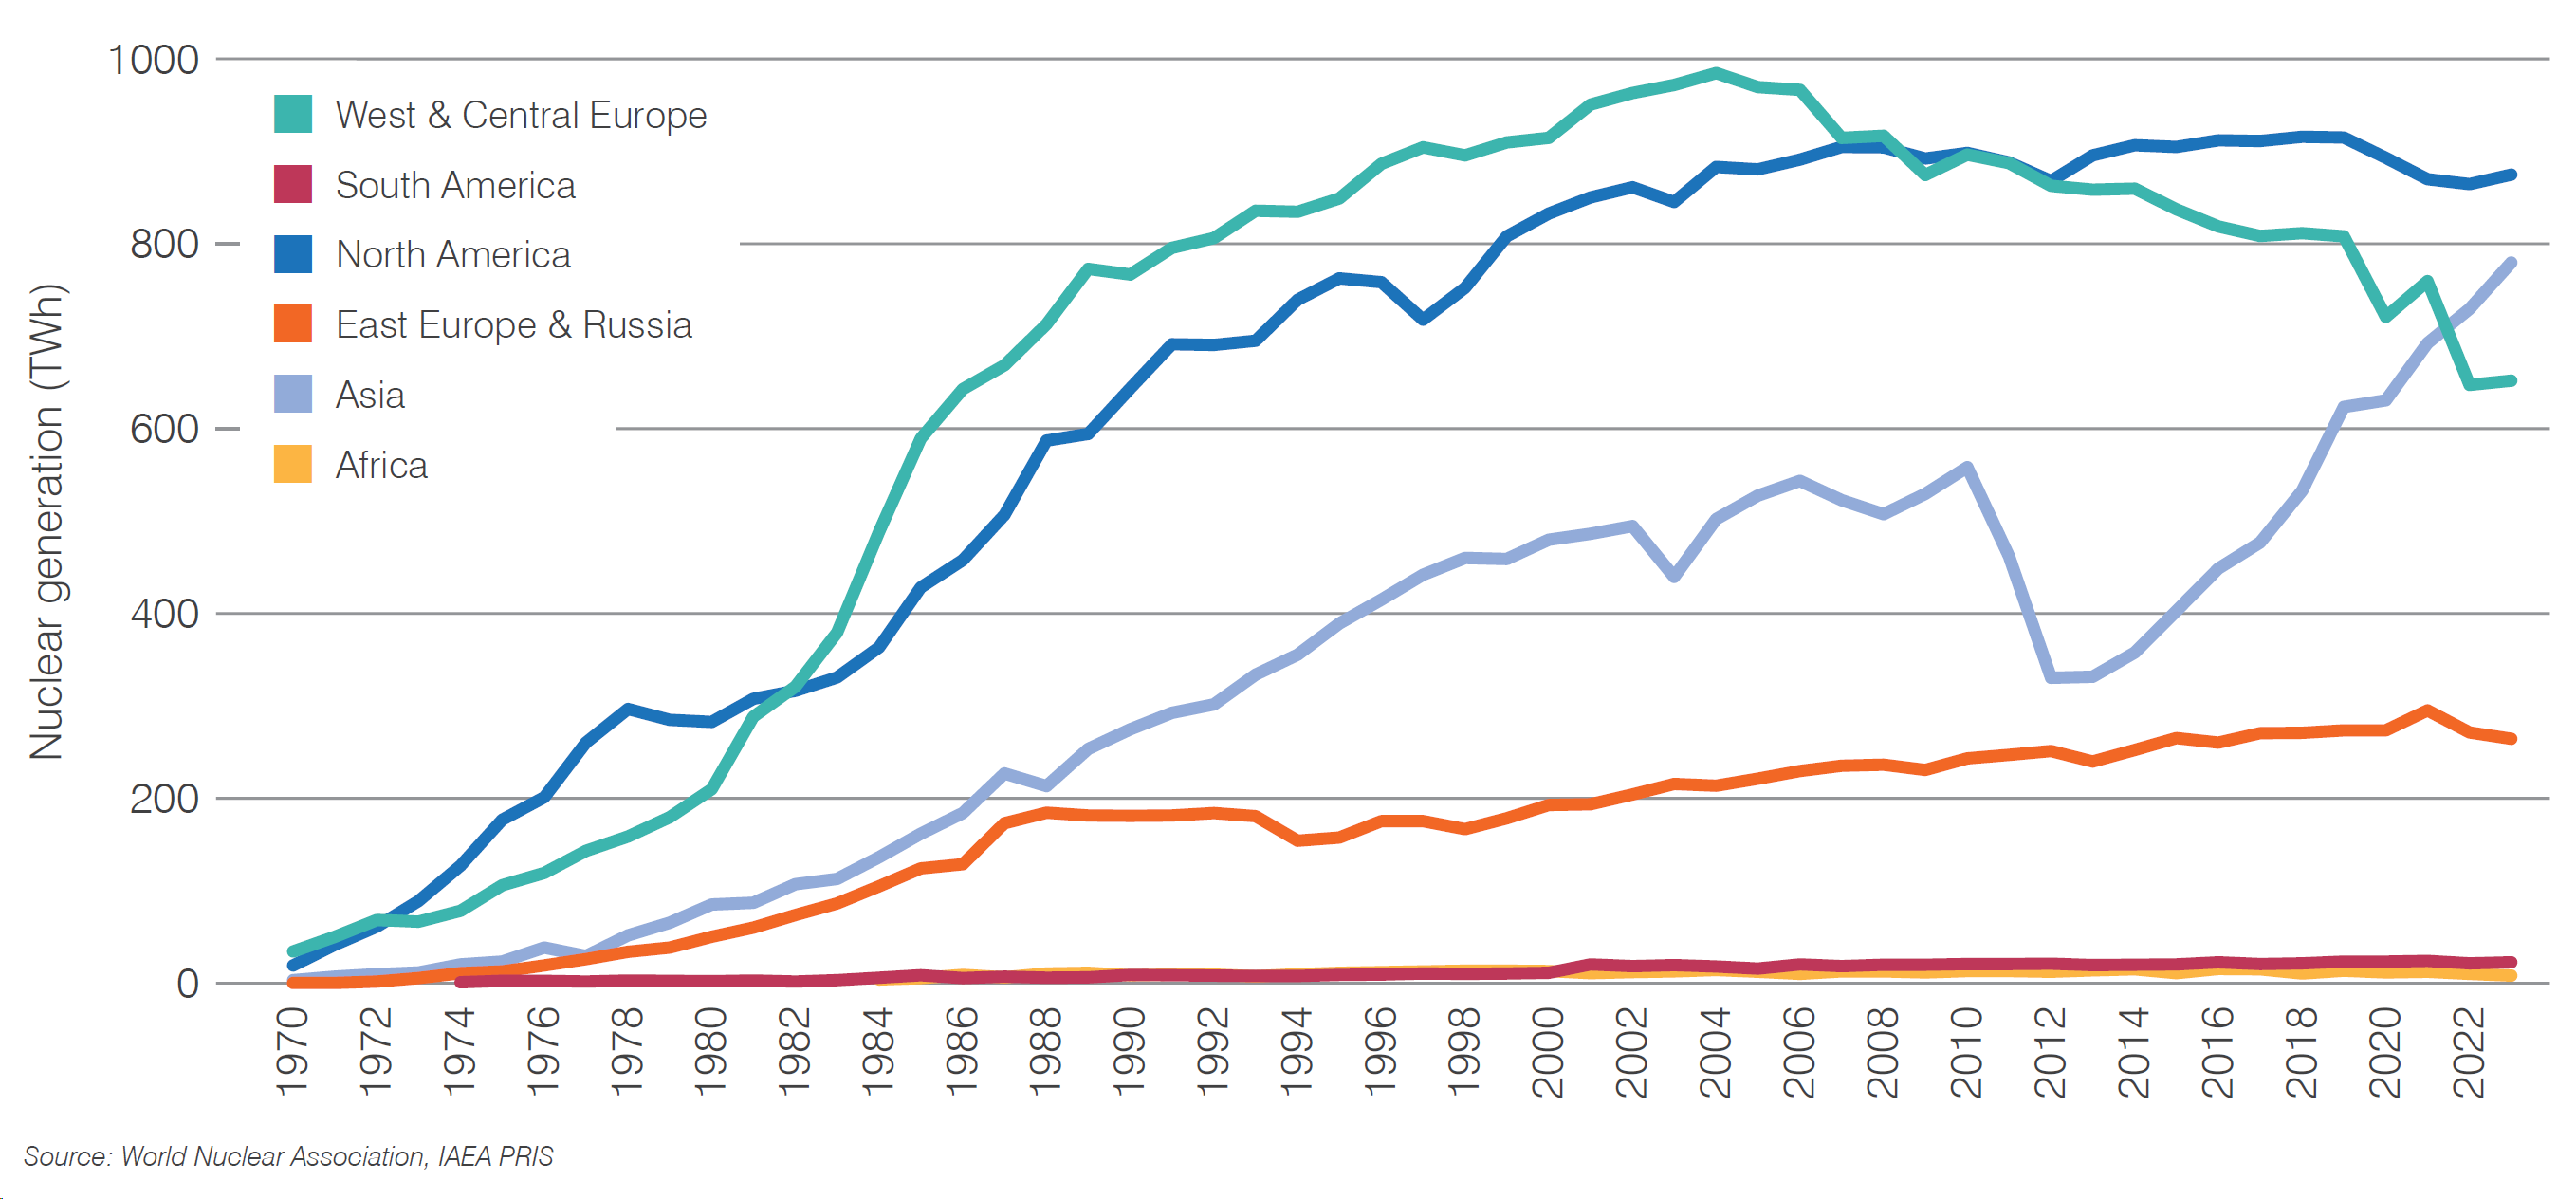
Generation continued to rise strongly in Asia, with new reactors connected to the grid since the start of 2023 in China, UAE, South Korea and Pakistan contributing to this increase. In other regions total generation in 2023 was broadly similar to the previous year.
Figure 2. Nuclear electricity generated by region
In 2023 the end-of-year capacity of operable nuclear power plants was 392 GWe, down one gigawatt on 2022. This includes 20 GWe of capacity in Japan and less than 1 GWe capacity in India where the status is categorized as 'Suspended Operation' by the International Atomic Energy Agency (IAEA).
The total number of operable reactors at the end of 2023 was 437, unchanged from 2022.
Table 1. Operable nuclear power reactors at year-end 2023 (change from 2022)
| Africa | Asia | East Europe & Russia |
North America |
South America |
West & Central Europe |
Total | |
|---|---|---|---|---|---|---|---|
| BWR | 19 (-1) | 33 | 8 | 60 (-1) | |||
| FNR | 2 | 2 | |||||
| GCR | 8 | 8 | |||||
| HTGR | 1 | 1 | |||||
| LWGR | 11 | 11 | |||||
| PHWR | 23 | 19 | 3 | 2 | 47 | ||
| PWR | 2 | 106 (+2) | 41 (+1) | 62 (+1) | 2 | 95 (-3) | 308 (+1) |
| Total | 2 | 149 (+1) | 54 (+1) | 114 (+1) | 5 | 113 (-3) | 437 |
The total capacity of reactors that produced electricity in 2023 was 368 GWe, up 3 GWe on 2022. In addition to the 21 GWe of reactor capacity in Japan and India, a further 9 GWe of operable reactors did not produce electricity in 2023, a similar total to 2022. The six reactors at Zaporizhzhia in Ukraine comprise nearly 6 GWe of this, but this is largely countered by the increase in generation from nuclear reactors in France.
Figure 3. Status of operable nuclear capacity
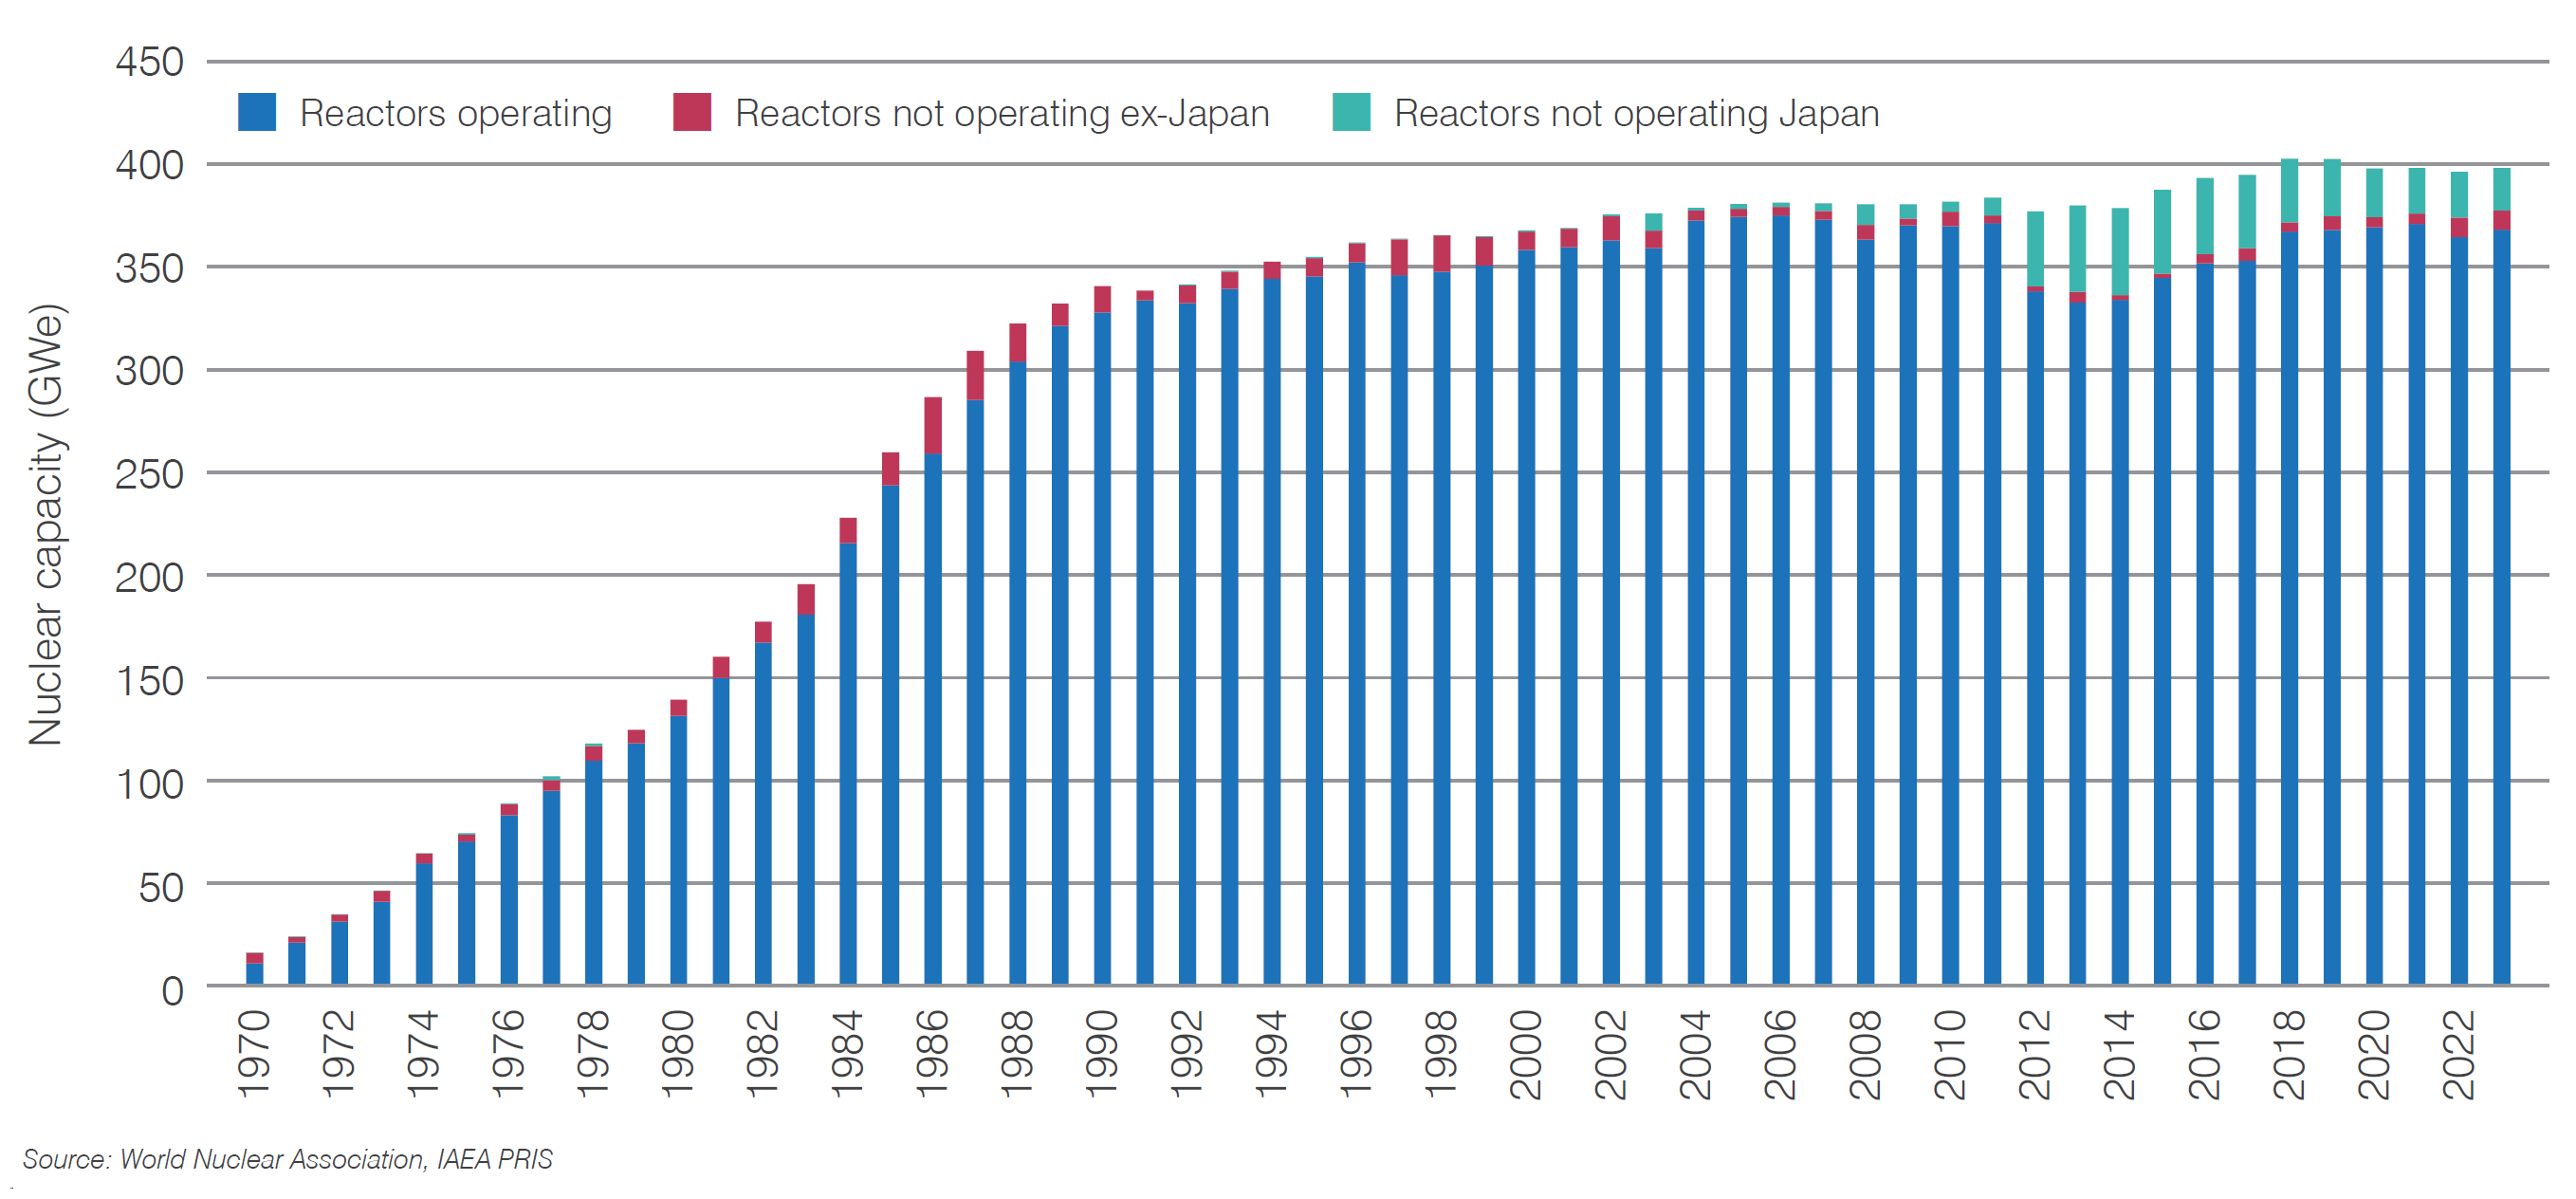
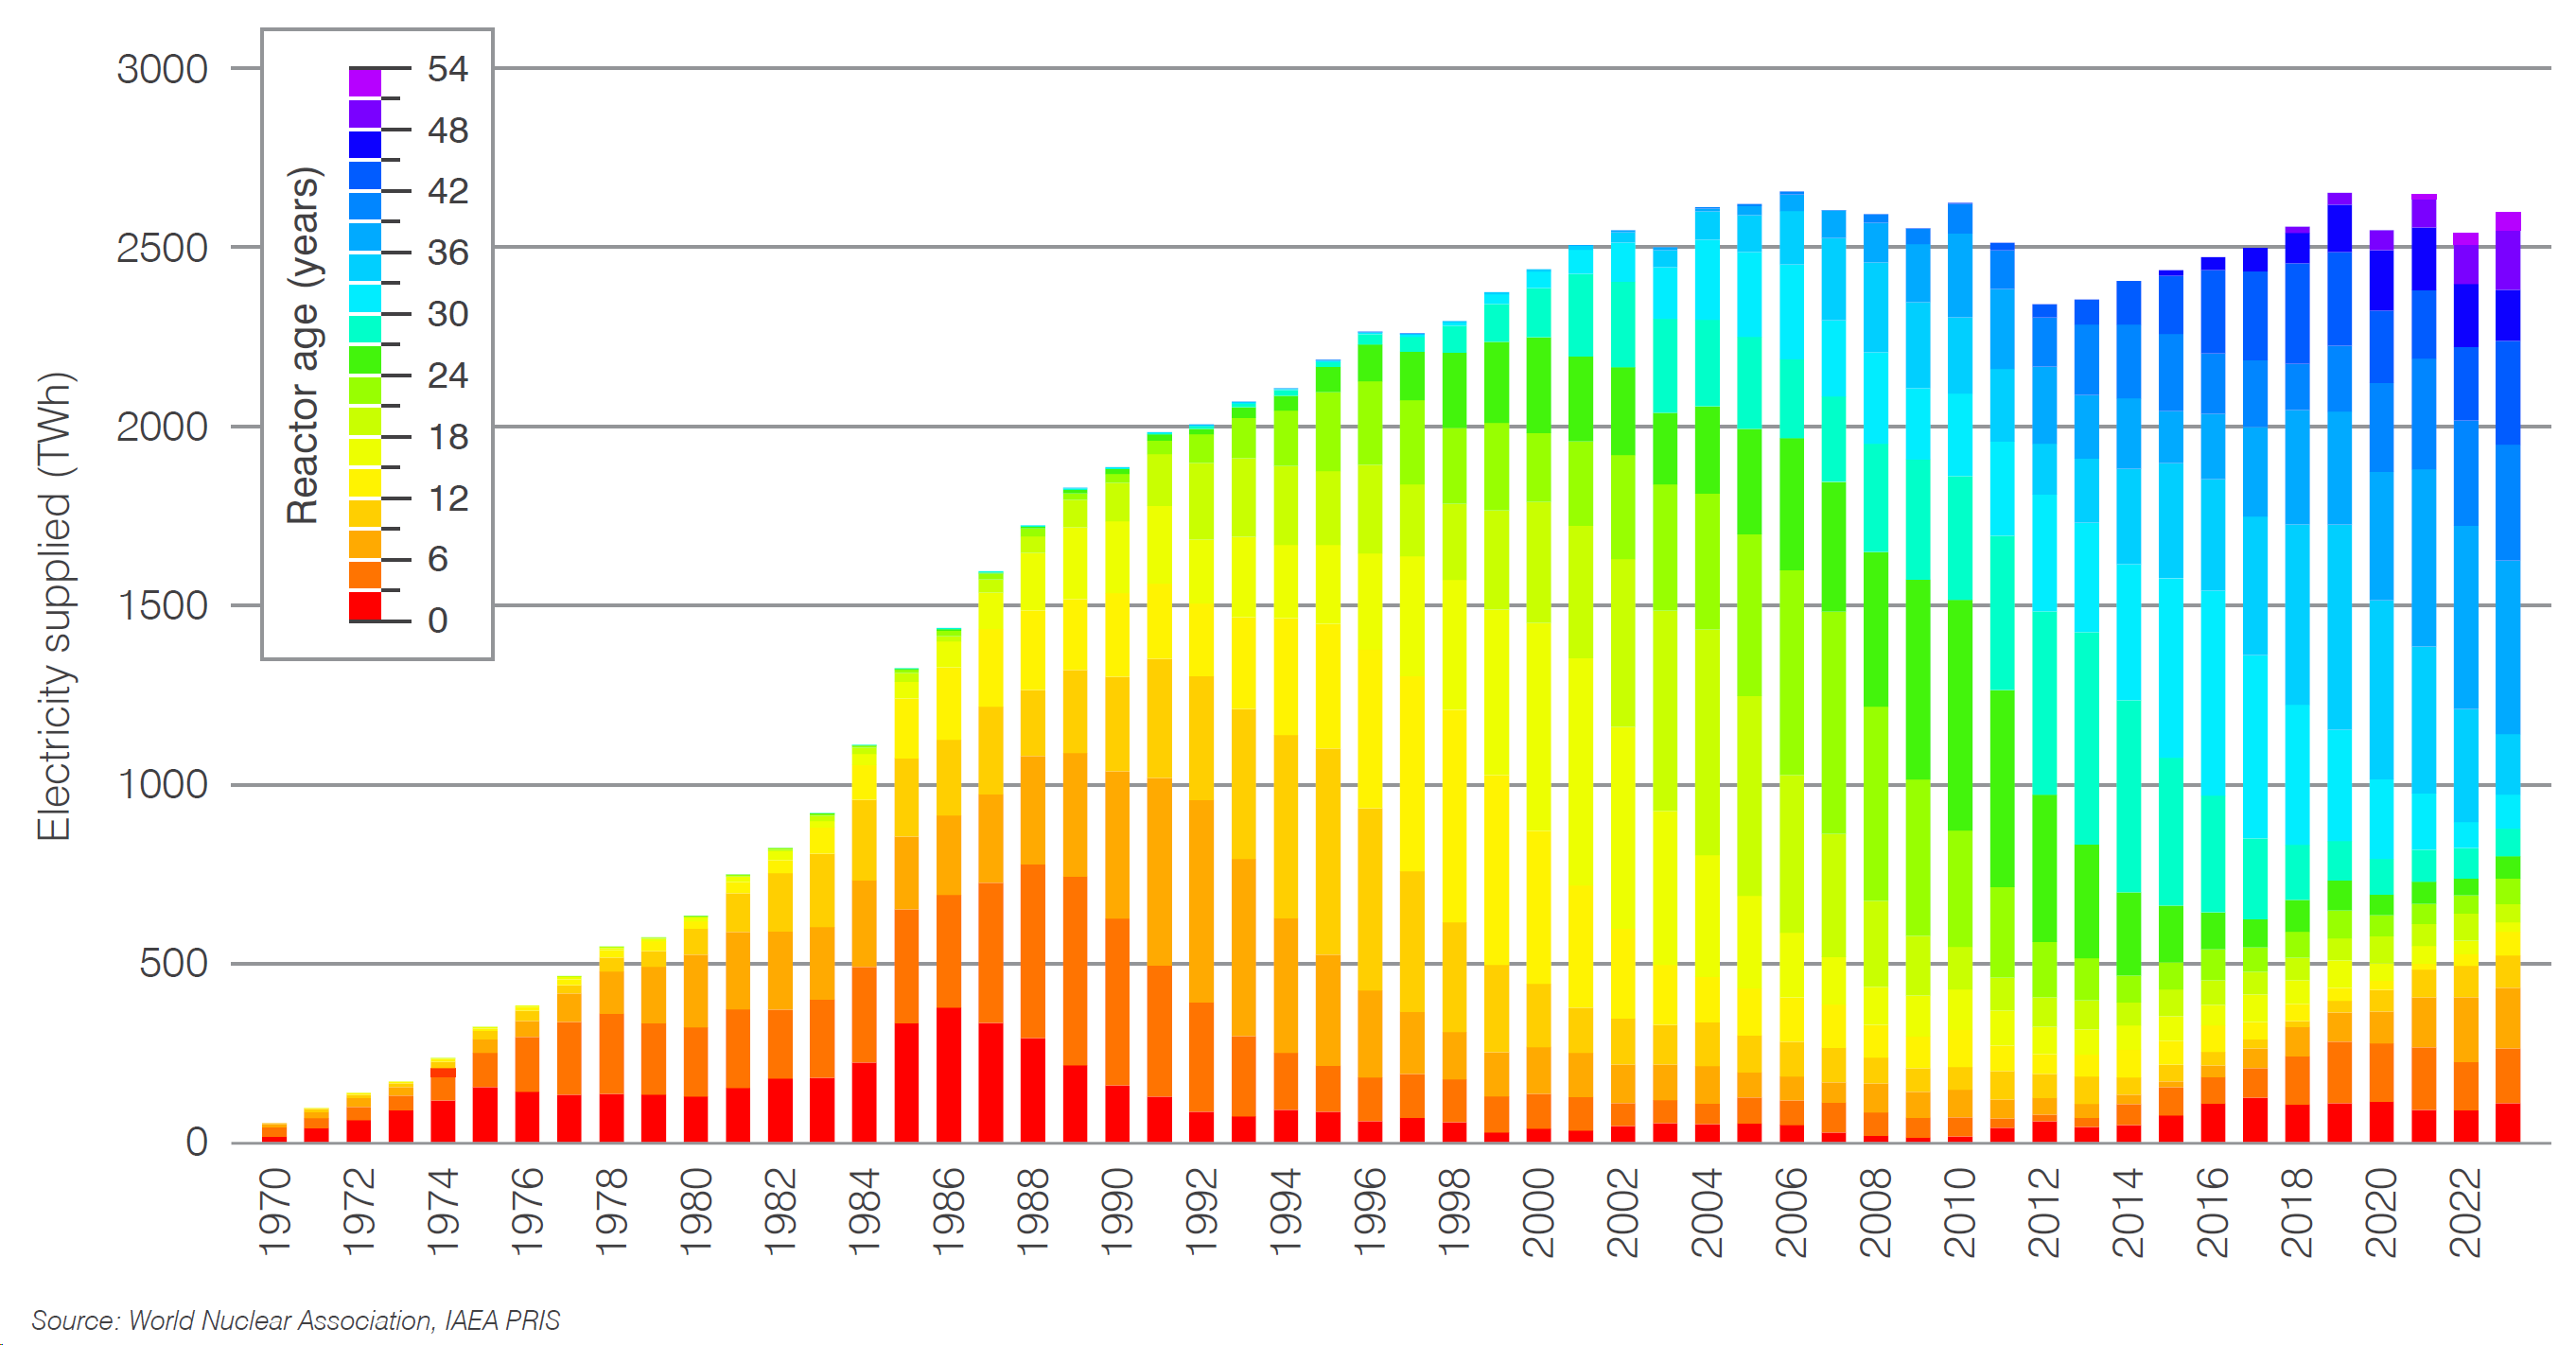
Figure 4 shows total global electricity generation from nuclear power plants by age in each year since 1970, with generation from reactors of different ages shown in different colours.
During the 1970s and '80s the rapid expansion of nuclear generation globally was a consequence of many new reactors coming online, indicated by the growth of redder hues in the chart. As those reactors enter their second and third decades of operation, and the pace of new reactor start-ups declines in the 1990s, the proportion of red in each year's bar reduces, reaching a minimum around 2013. Over the last decade, with increases in the number of reactors being commissioned, the amount of electricity generated by younger reactors has started to increase again, shown by the increasing amount of red in the bars over the last decade.
Figure 4. Total global nuclear electricity generation by age of reactor
Operational Performance
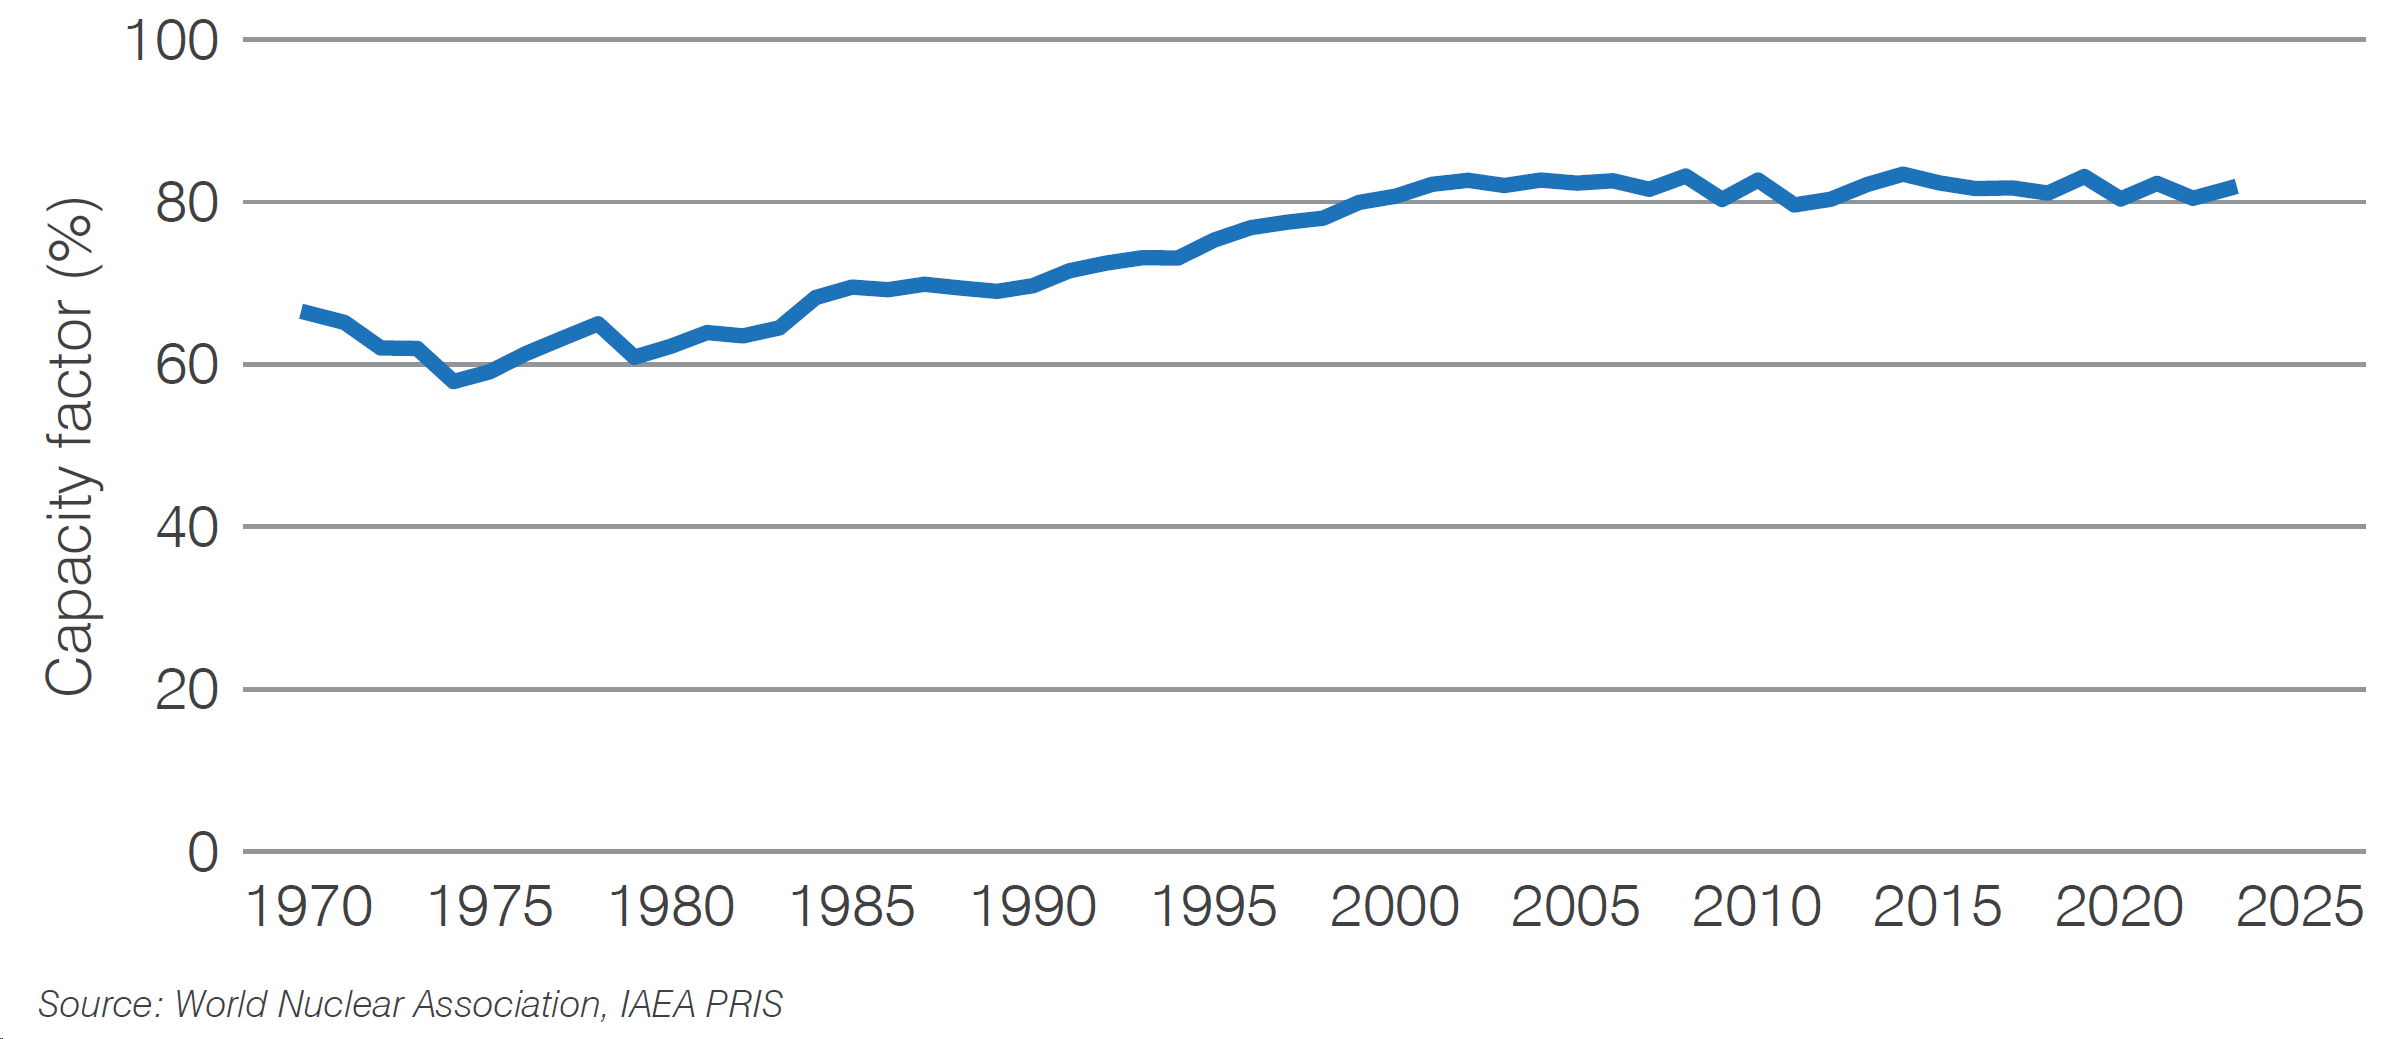
In 2023 the global average capacity factor was 81.5%, up from 80.4% in 2022, continuing the trend of high global capacity factors seen since 2000. Capacity factors in this section are based on the performance of those reactors that report electricity generation in any one calendar year.
Figure 5. Global average capacity factor
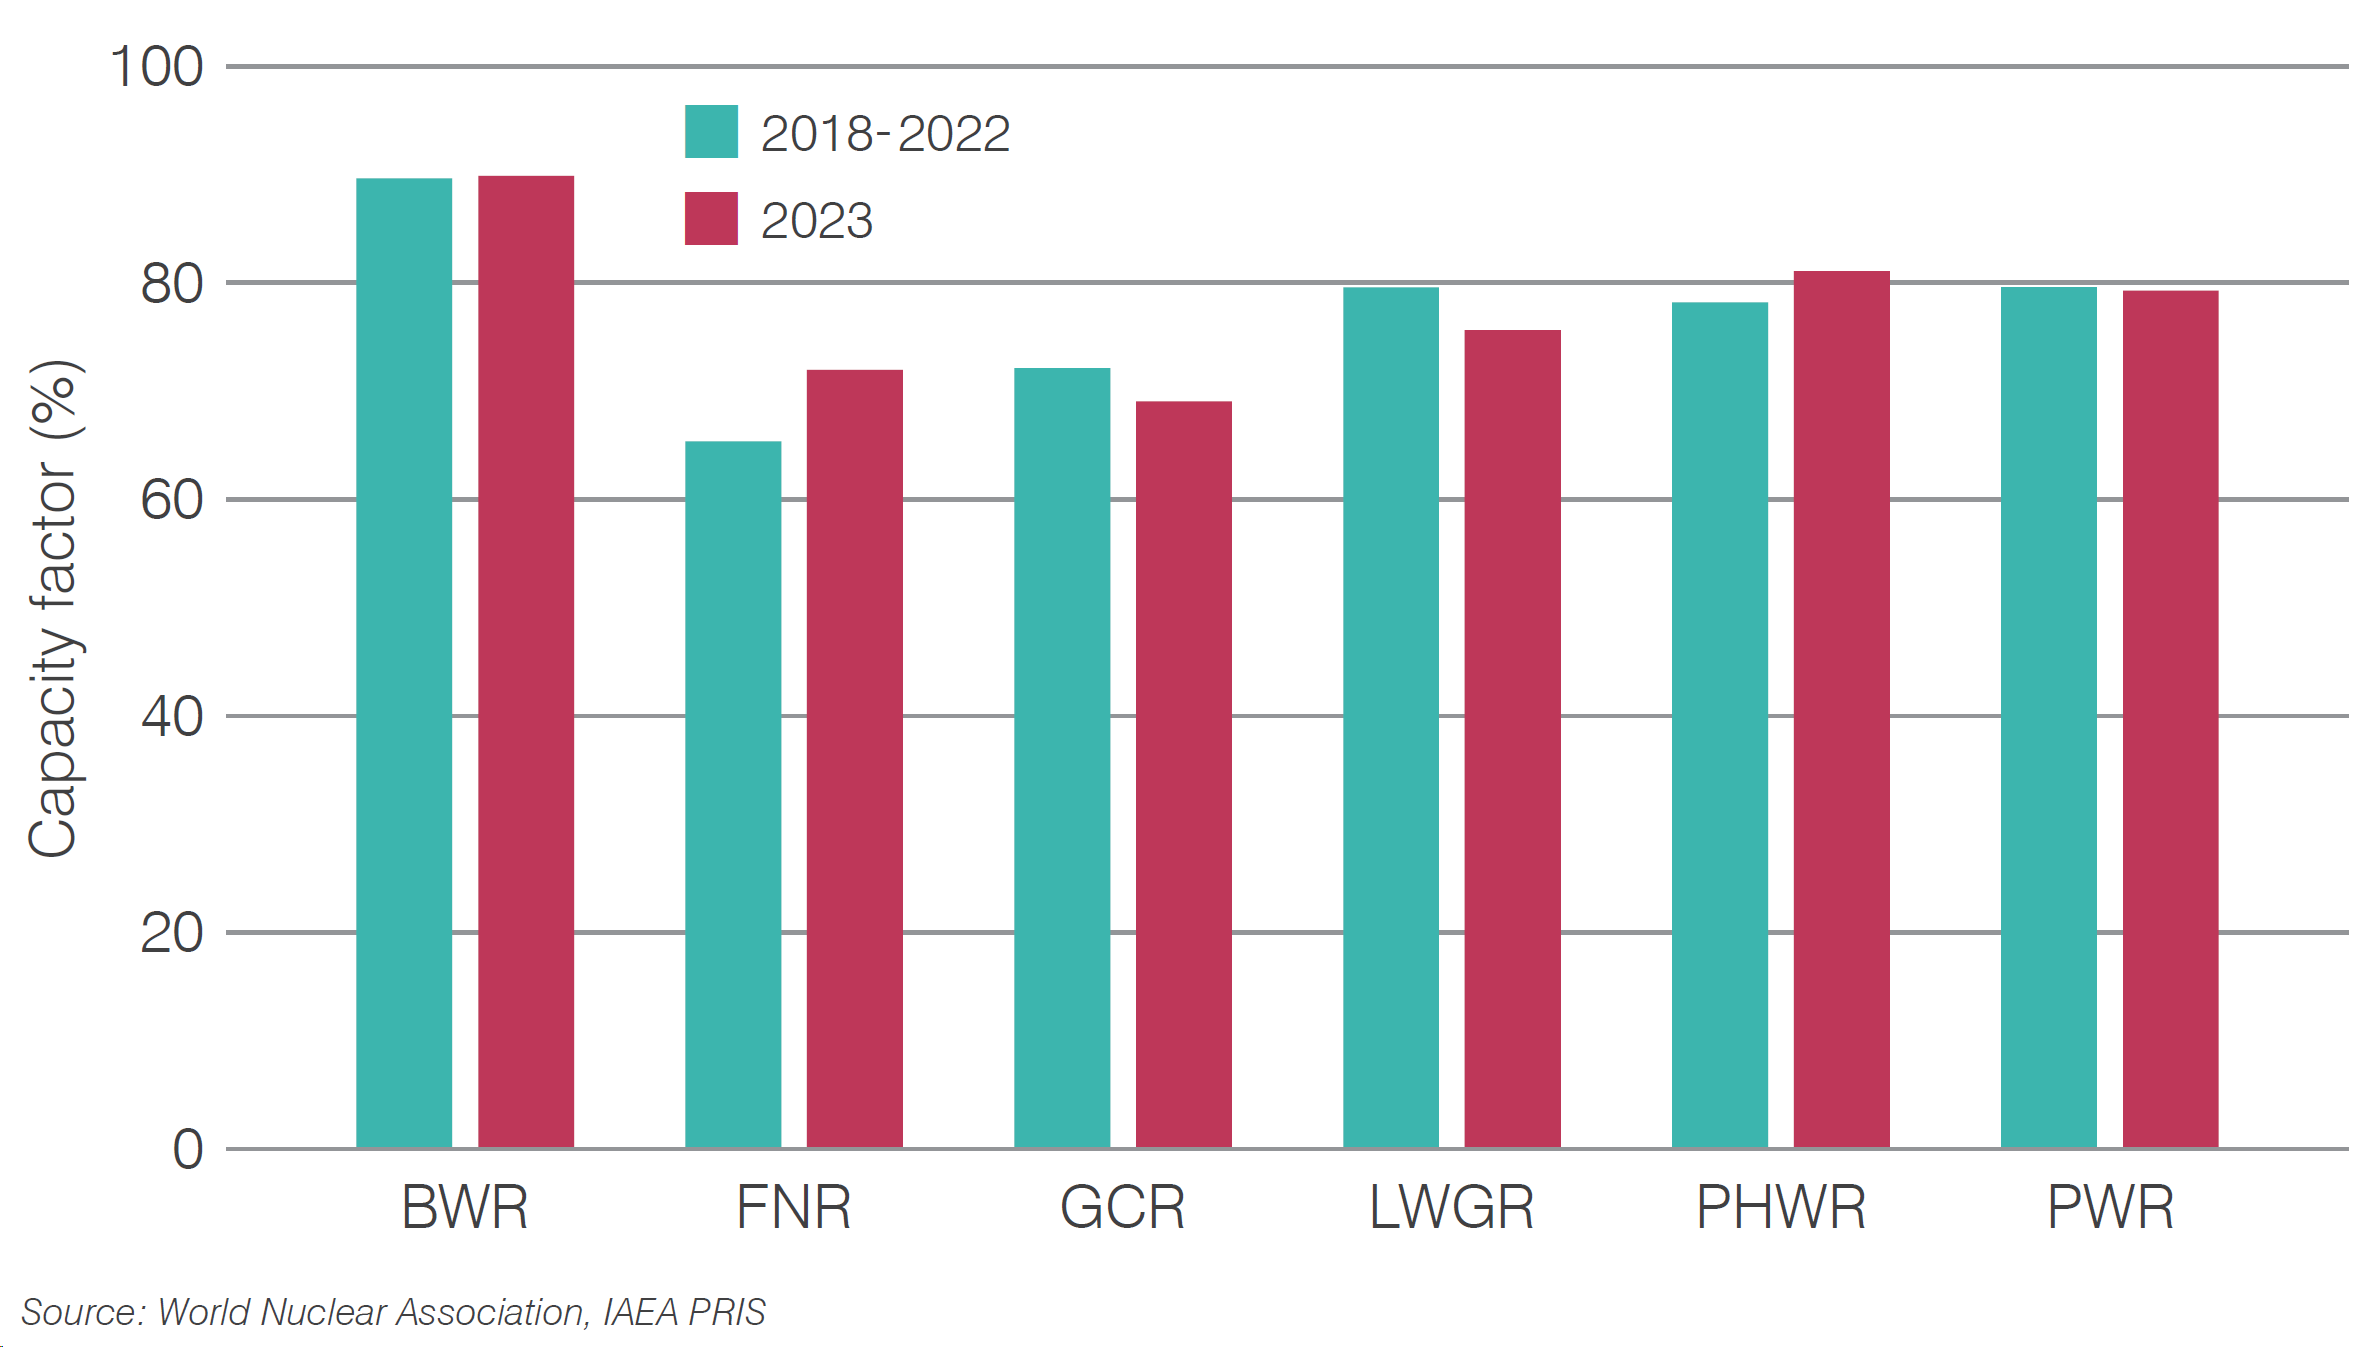
In 2023, capacity factors for different reactor types were broadly consistent with those achieved in the previous five years. On average, boiling water reactors (BWRs) achieve the highest capacity factors.
Figure 6. Capacity factor by reactor type
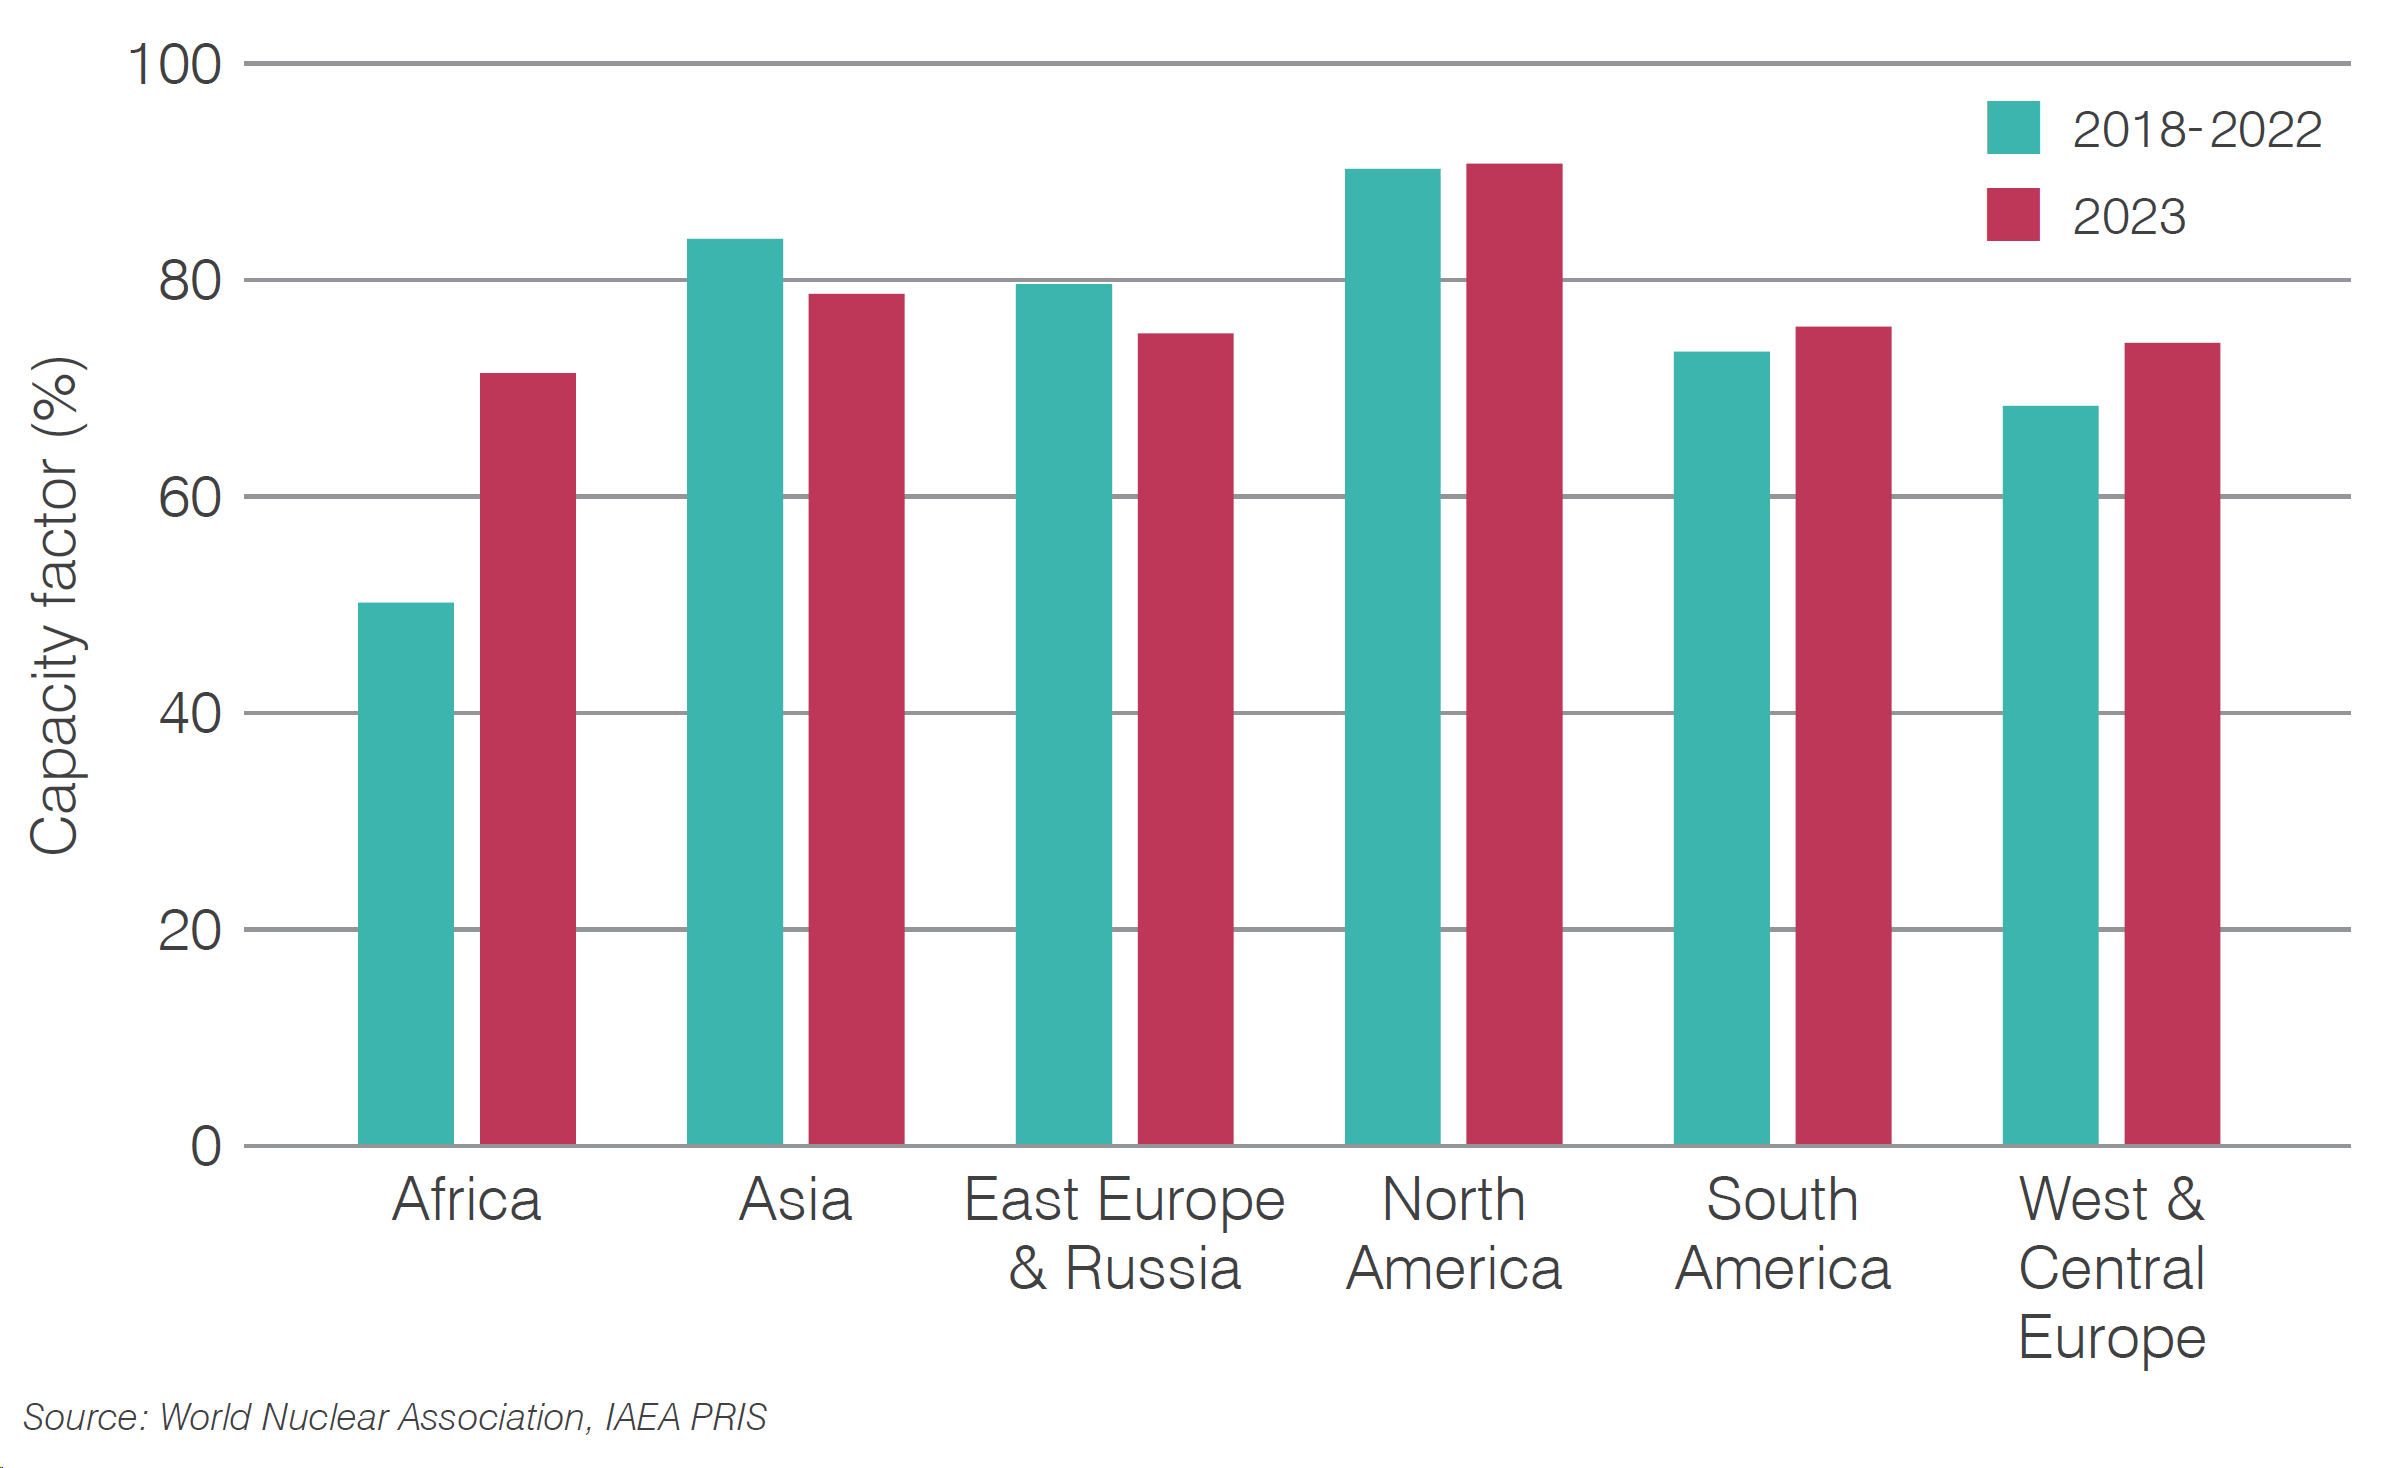
Capacity factors in 2023 for reactors in most geographical regions were also broadly consistent with the average achieved in the previous five years, with North America maintaining the highest average capacity factors. In Africa, the sole nuclear power plant operating there, South Africa's Koeberg, underwent extensive outages in 2022 and 2023 for steam generator replacements.
Figure 7. Capacity factor by region
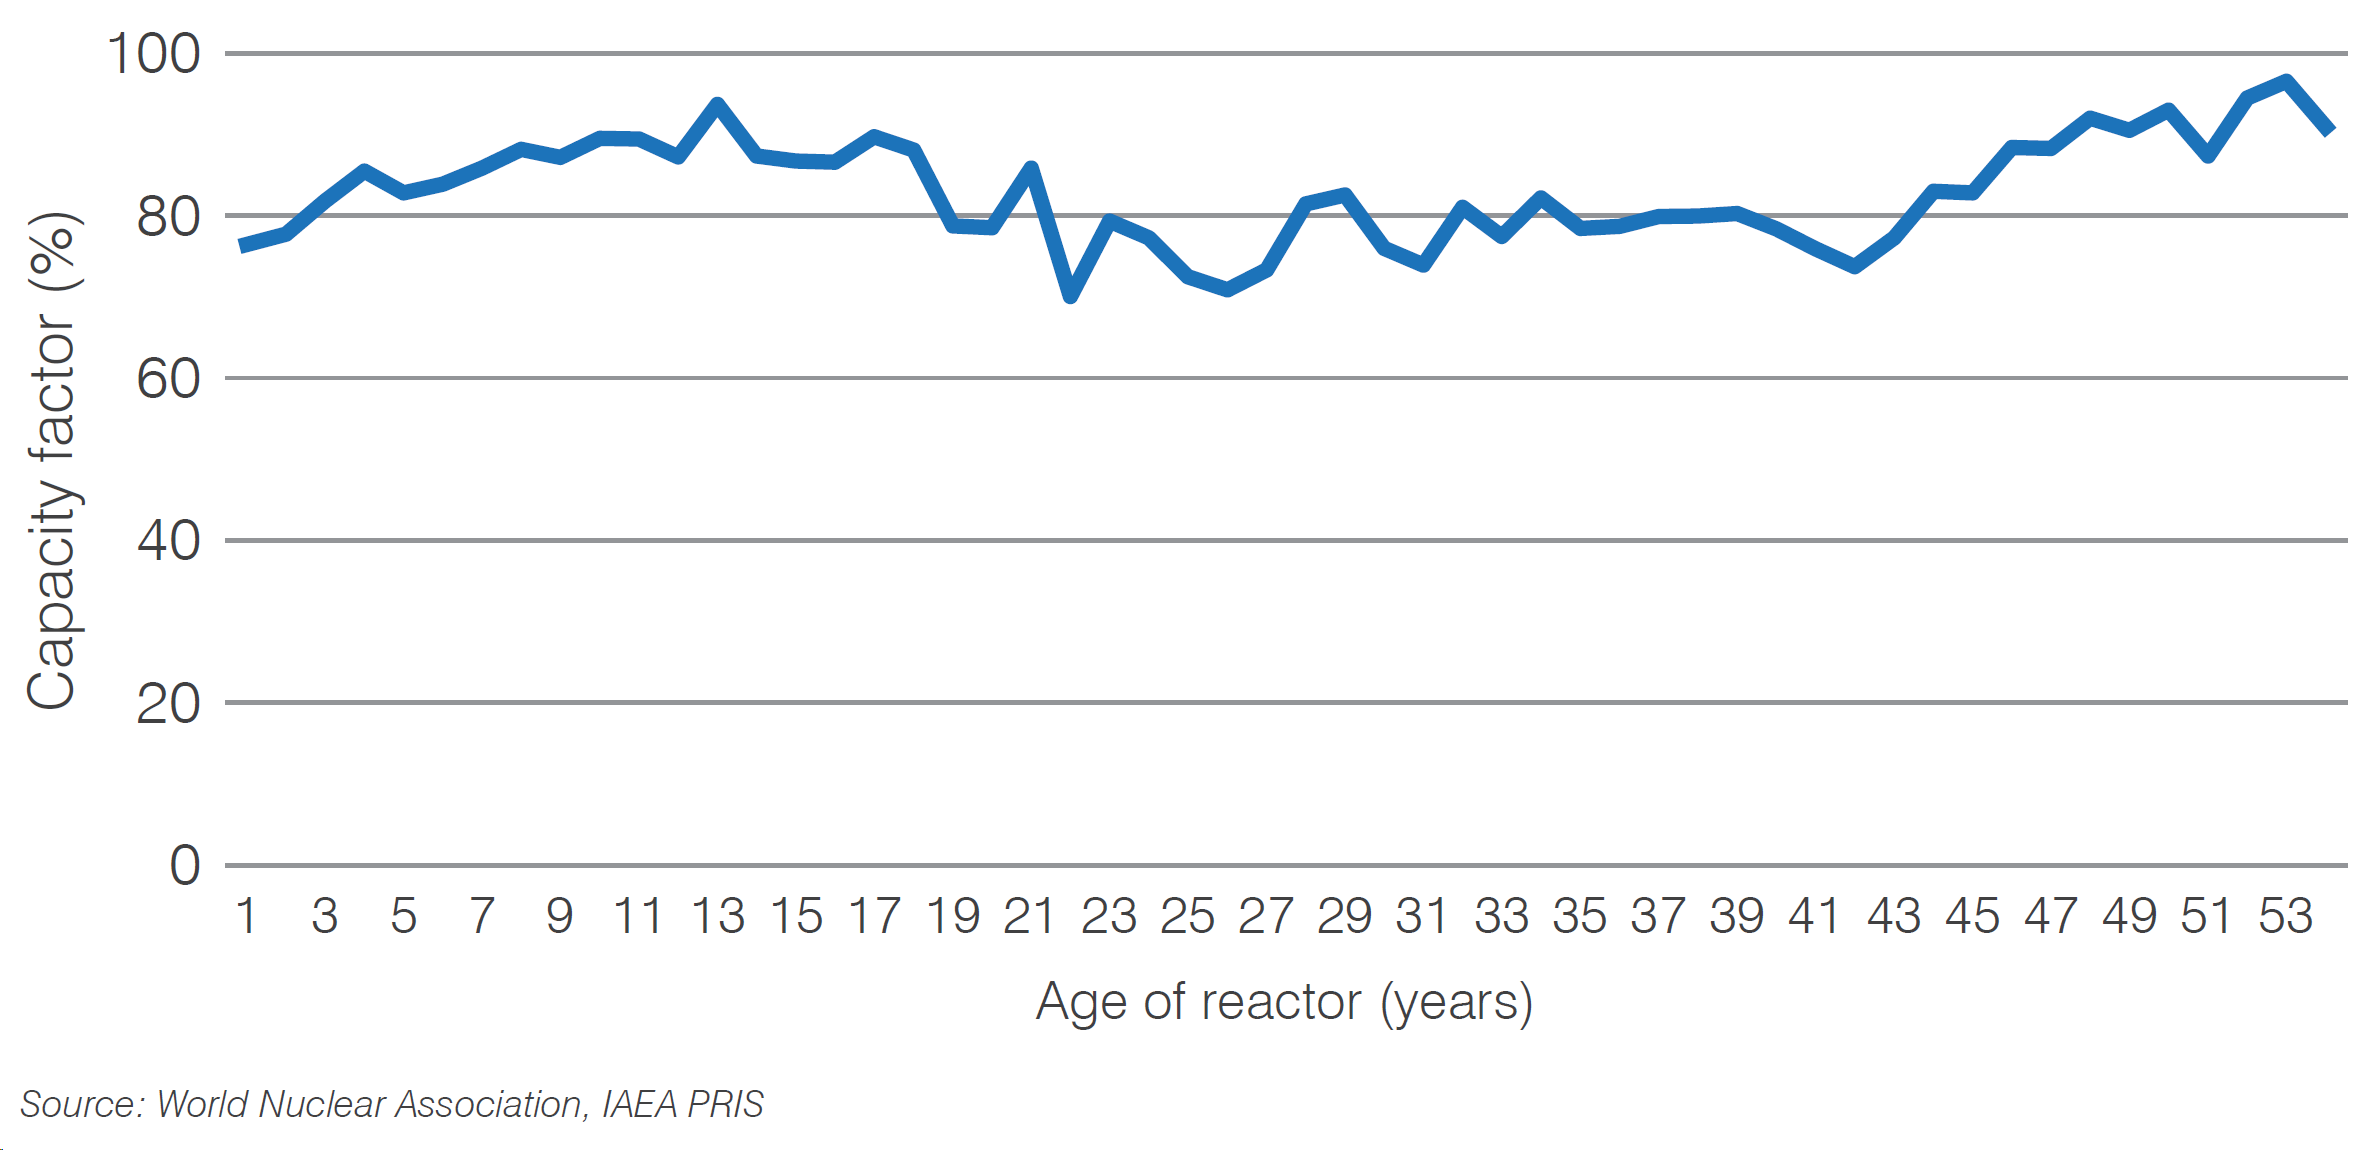
 There is no overall age-related decline in nuclear reactor performance, although there is some variation, with lower average capacity factors for those reactors between 25 and 35 years of operation and higher than average capacity factors for those reactors exceeding 45 years of operation.
Figure 8. Mean capacity factor 2019-2023 by age of reactor
The spread of capacity factors in 2023 is broadly similar to the average of the previous five years. Two-thirds of reactors have a capacity factor over 80%.
Figure 9. Percentage of units by capacity factor
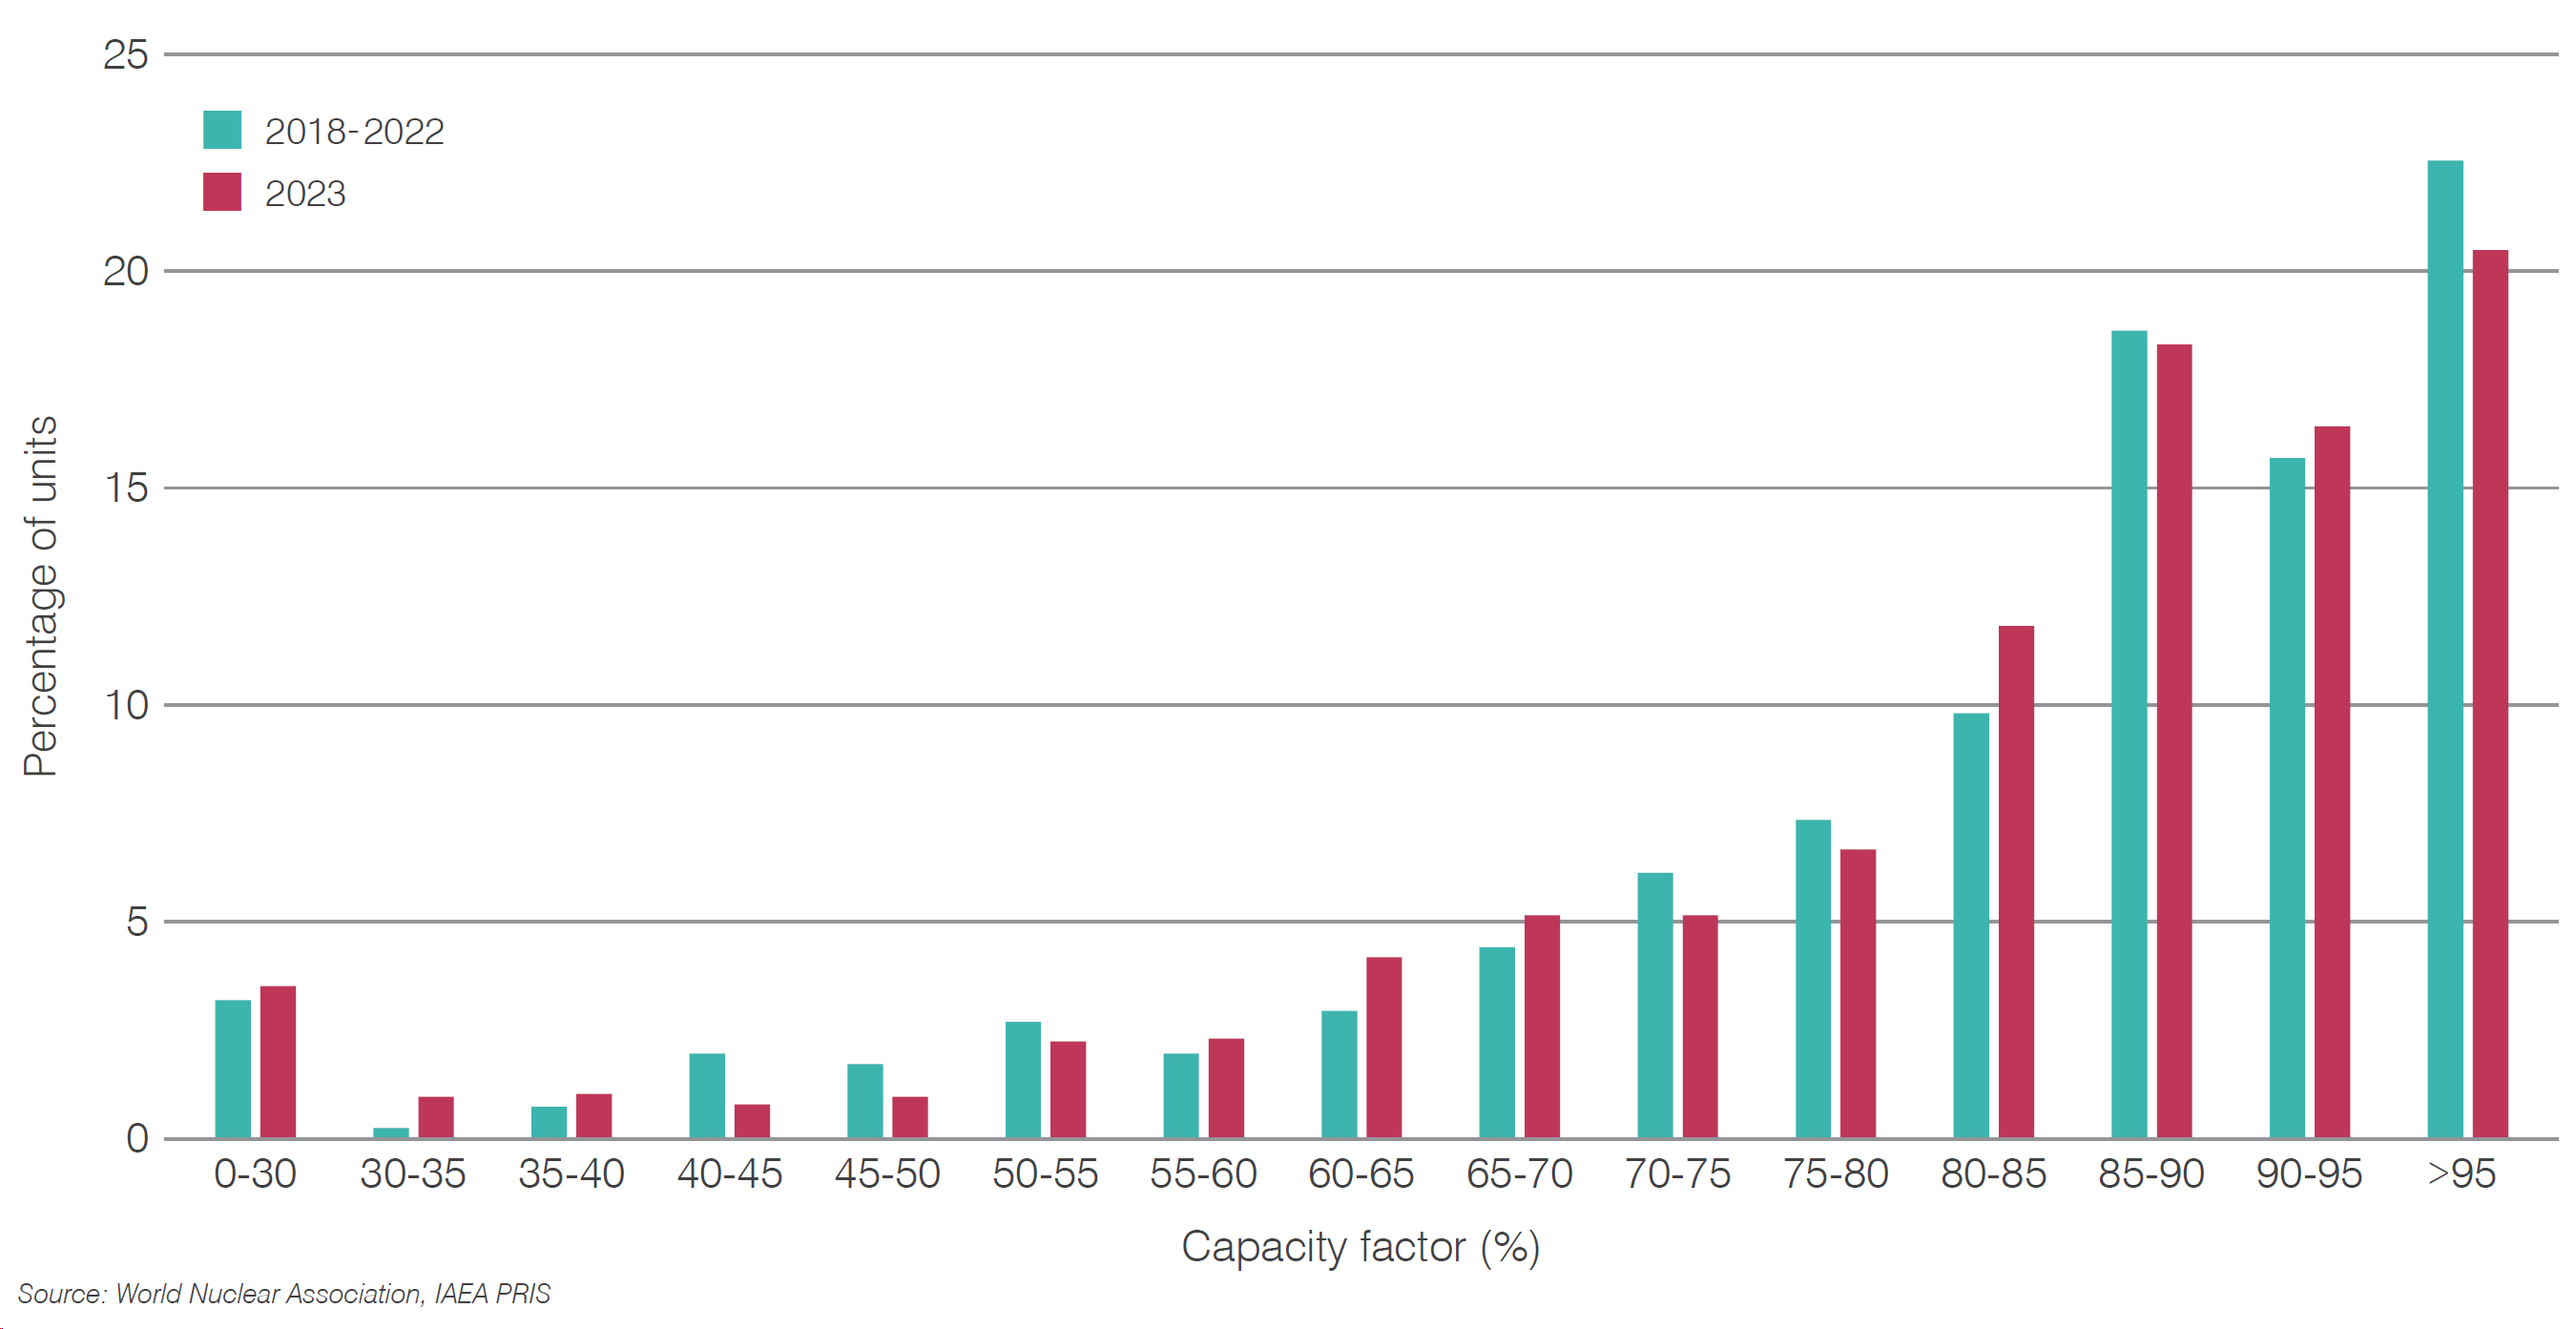
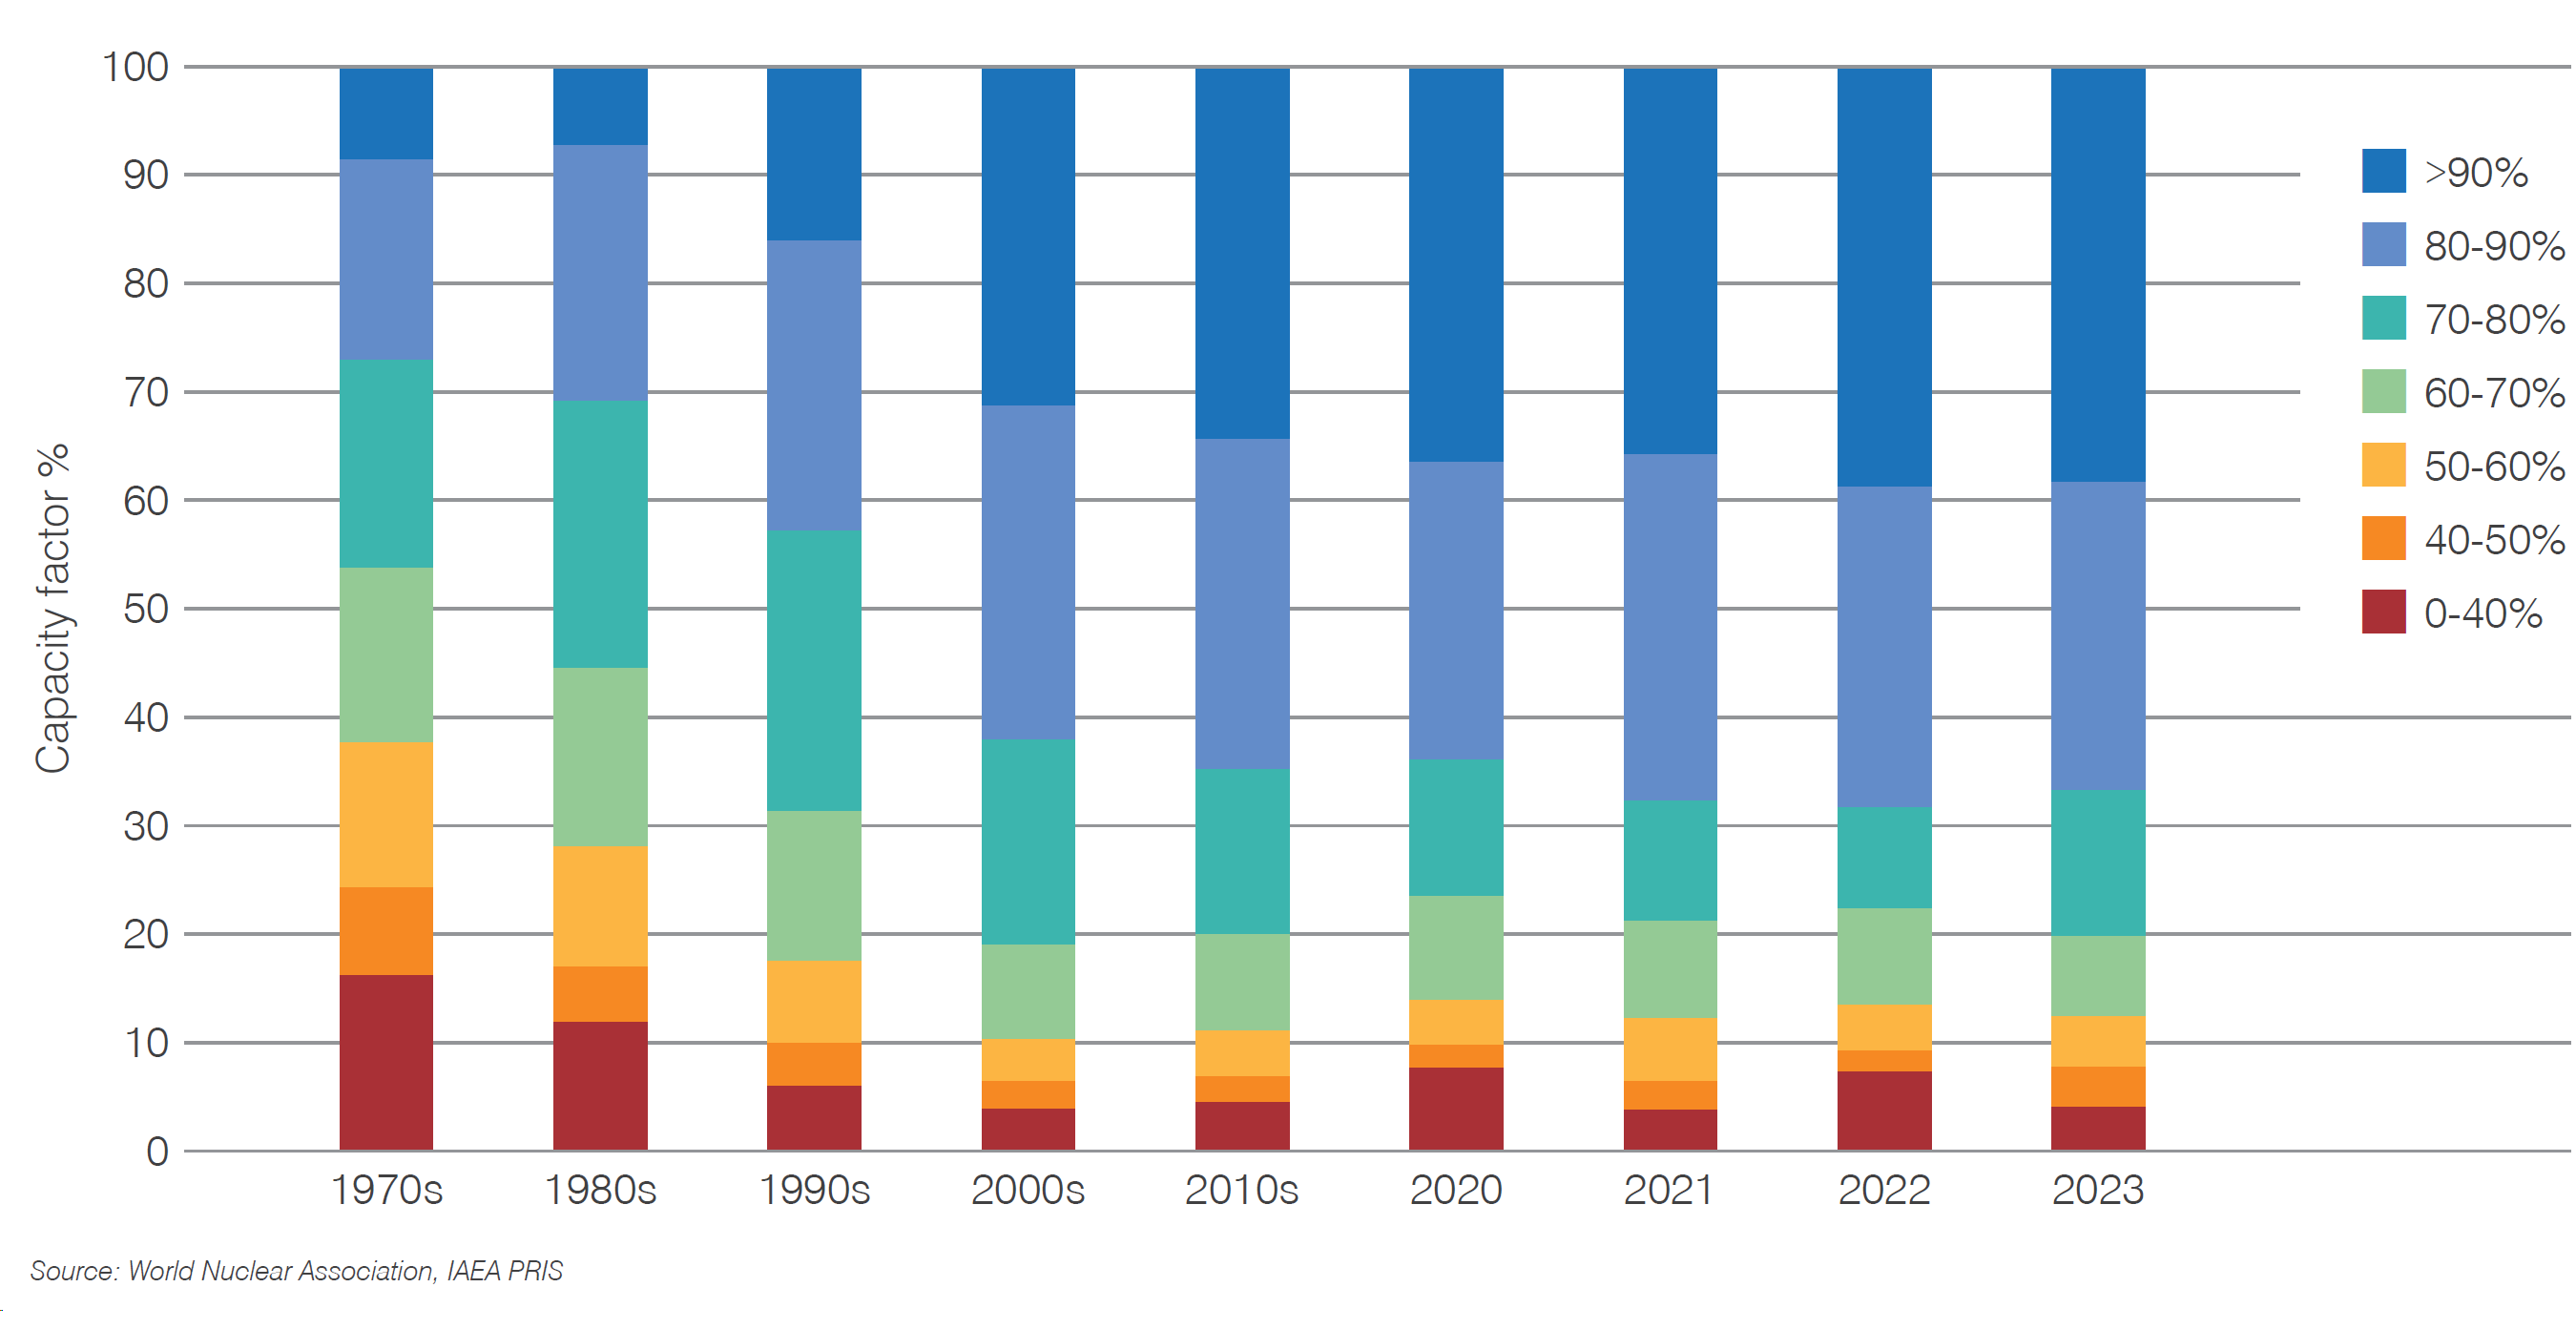
There has been a steady improvement in average capacity factors in each decade since the 1970s. The high capacity factors achieved in the 2010s have continued from 2020 onwards. The spread of capacity factors in 2023 is broadly similar to the average of the previous five years. Two-thirds of reactors have a capacity factor over 80%.
Figure 10. Long-term trends in capacity factor
New construction
In 2023 construction began on six large pressurized water reactors, five in China and one at the El Dabaa site in Egypt.
Table 2. Reactor construction starts in 2023
| Location | Model | Process | Design net capacity (MWe) | Construction start date | |
|---|---|---|---|---|---|
| Sanmen 4 | China | CAP1000 | PWR | 1163 | 22 March 2023 |
| Haiyang 4 | China | CAP1000 | PWR | 1161 | 22 April 2023 |
| El Dabaa 3 | Egypt | VVER-1200 | PWR | 1100 | 3 May 2023 |
| Lufeng 6 | China | Hualong One | PWR | 1116 | 26 August 2023 |
| Lianjiang 1 | China | CAP1000 | PWR | 1224 | 27 September 2023 |
| Xudabao1 | China | CAP1000 | PWR | 1000 | 3 November 2023 |
Source: World Nuclear Association, IAEA PRIS
With six construction starts in 2023, and five reactor connections to the grid, the total number of units under construction at the end of 2023 was 61, one more than at the end of 2022.
Table 3. Units under construction year-end 2023
| BWR | FBR | PHWR | PWR | Total | |
|---|---|---|---|---|---|
| Argentina | 1 | 1 | |||
| Bangladesh | 2 | 2 | |||
| Belarus | 0(-1) | ||||
| Brazil | 1 | 1 | |||
| China | 2 | 24 (+4) | 26 (+4) | ||
| Egypt | 3(+`1) | 3(+`1) | |||
| France | 1 | 1 | |||
| India | 1 | 3 | 4 | 8 | |
| Iran | 1 | 1 | |||
| Japan | 2 | 2 | |||
| Russia | 1 | 2 | 3 | ||
| Slovakia | 1 (-1) | 1 (-1) | |||
| South Korea | 2 (-1) | 2 (-1) | |||
| Turkey | 4 | 4 | |||
| Ukraine | 2 | 2 | |||
| United Arab Emirates | 1 | 1 | |||
| United Kingdom | 2 | 2 | |||
| United States of America | 1 (-1) | 1 (-1) | |||
| Total | 2 | 4 | 3 | 52 (+1) | 61 (+1) |
Five reactors were connected to the grid for the first time in 2023. This included Mochovce 3 in Slovakia, where construction had started in 1987, before being halted in 1990, and resuming in 2015.
| Location | Reference unit power (MWe) | Model | Reactor type |
Construction start | First grid connection |
|
|---|---|---|---|---|---|---|
| Fangchenggang 3 | China | 1105 | Hualong One | PWR | 24 December 2015 | 10 January 2023 |
| Mochovce 3 | Slovakia | 440 | VVER-440/V-213 | PWR | 27 January 1987 | 31 January 2023 |
| Vogtle 3 | USA | 1117 | AP1000 | PWR | 2 March 2013 | 31 March 2023 |
| Ostrovets 2 | Belarus | 1110 | VVER V-1200/V-491 | PWR | 27 April 2014 | 13 May 2023 |
| Shin-Hanul 2 | South Korea | 1340 | APR-1400 | PWR | 19 June 2013 | 21 December 2023 |
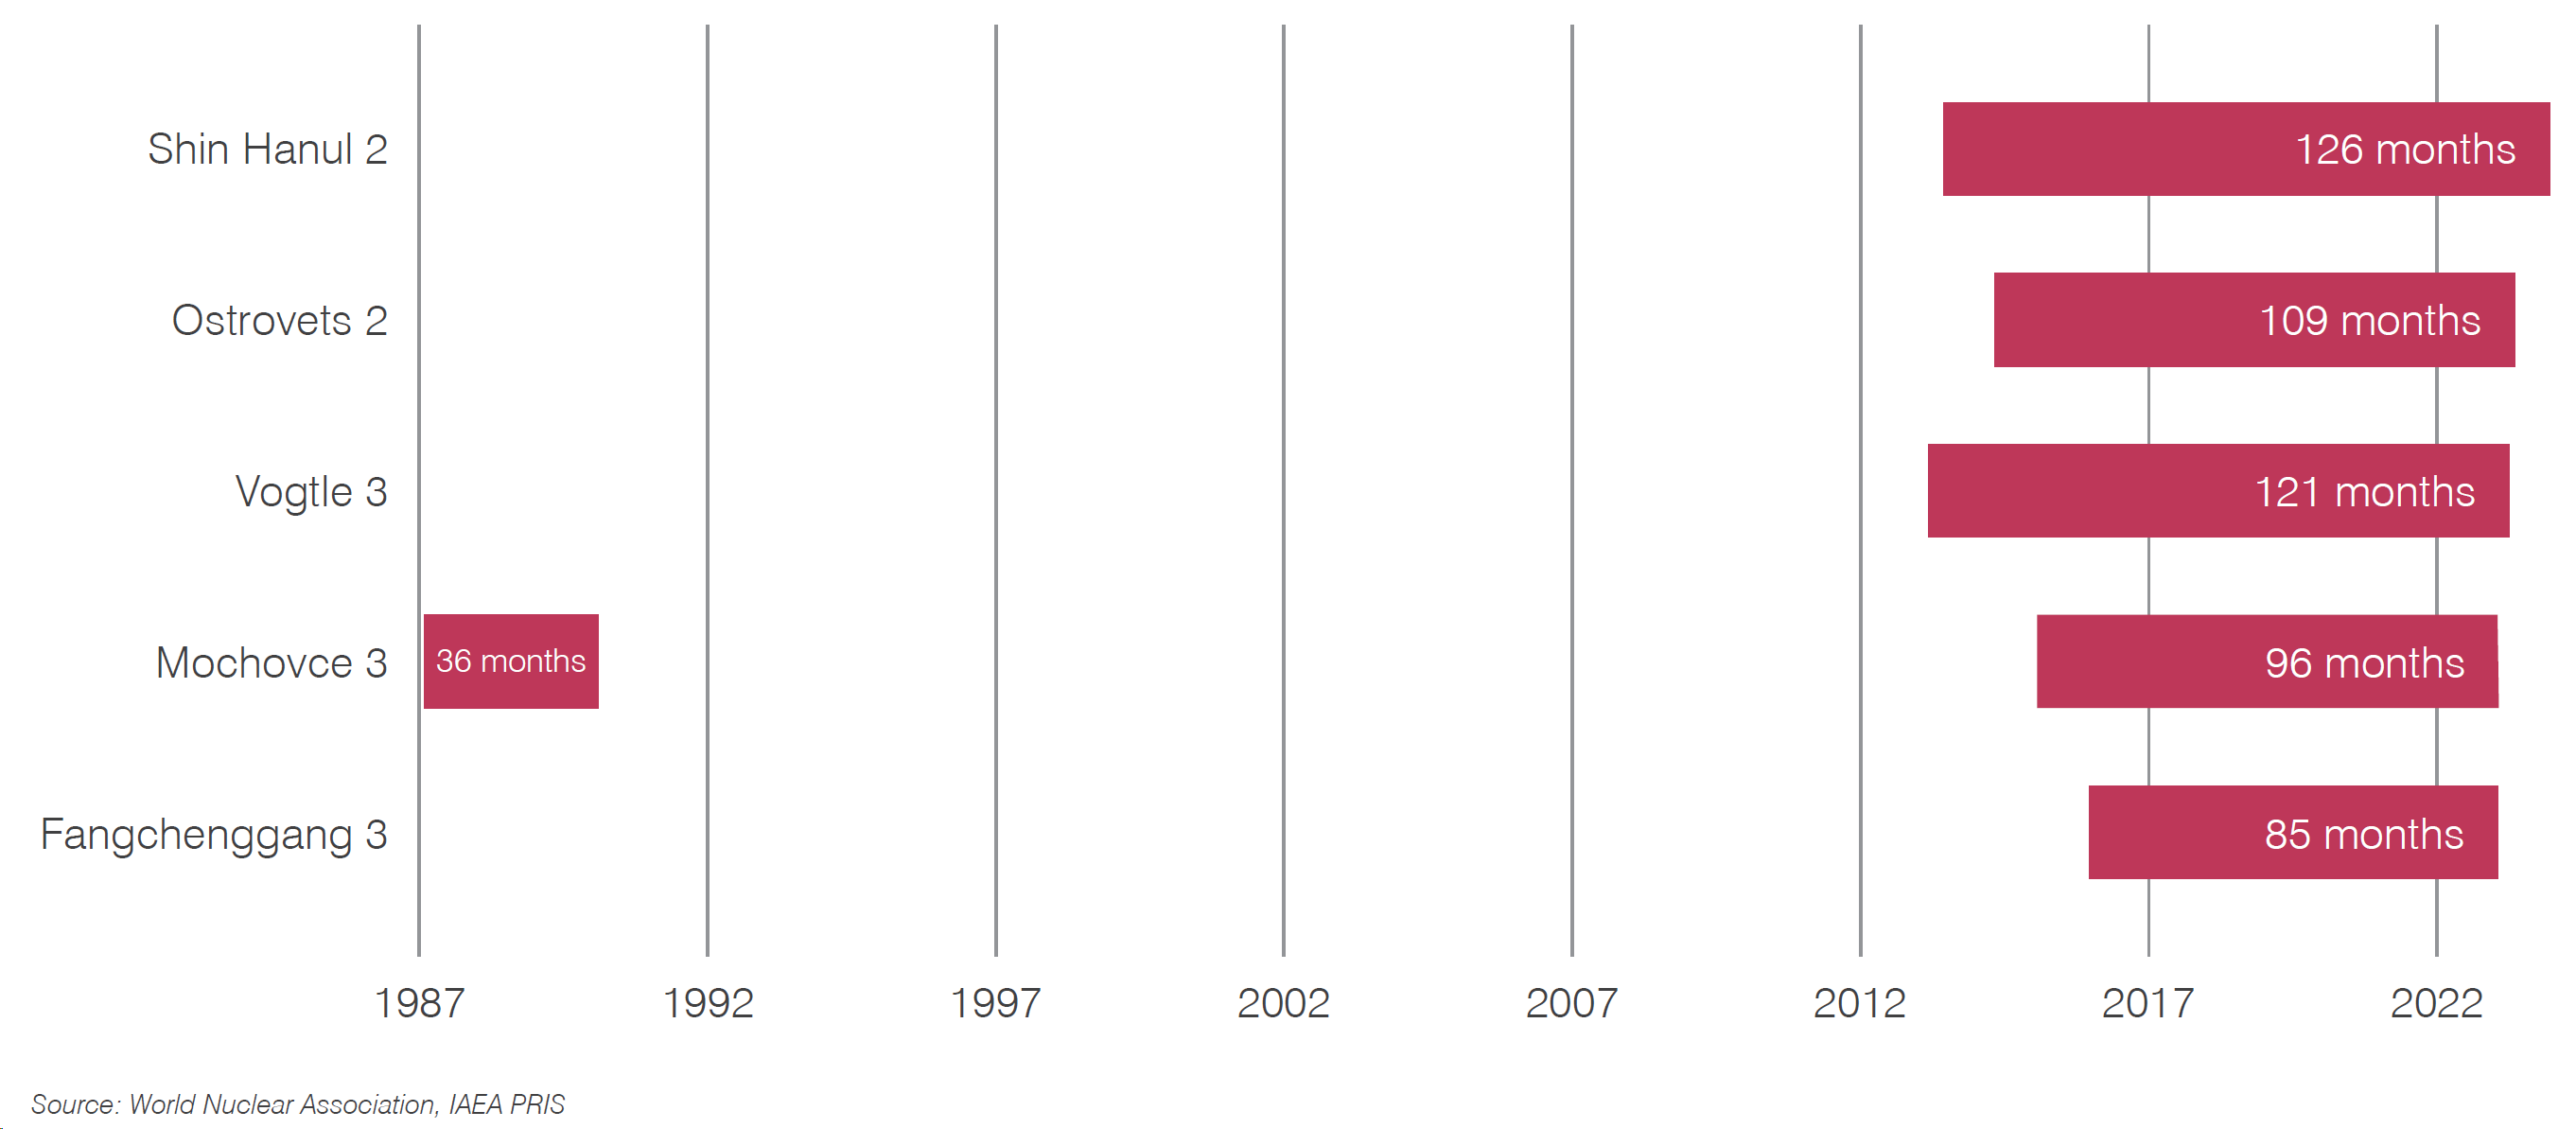
The average construction times for those five reactors is considerably higher than in recent years, with a median time of 121 months, compared to 88 months in 2021 and 89 months in 2022, and a mean construction time of 115 months. Construction times for Shin Hanul 2 and Ostrovets 2 both took longer than the first units at each site.
Figure 11. Construction times of units grid-connected in 2023
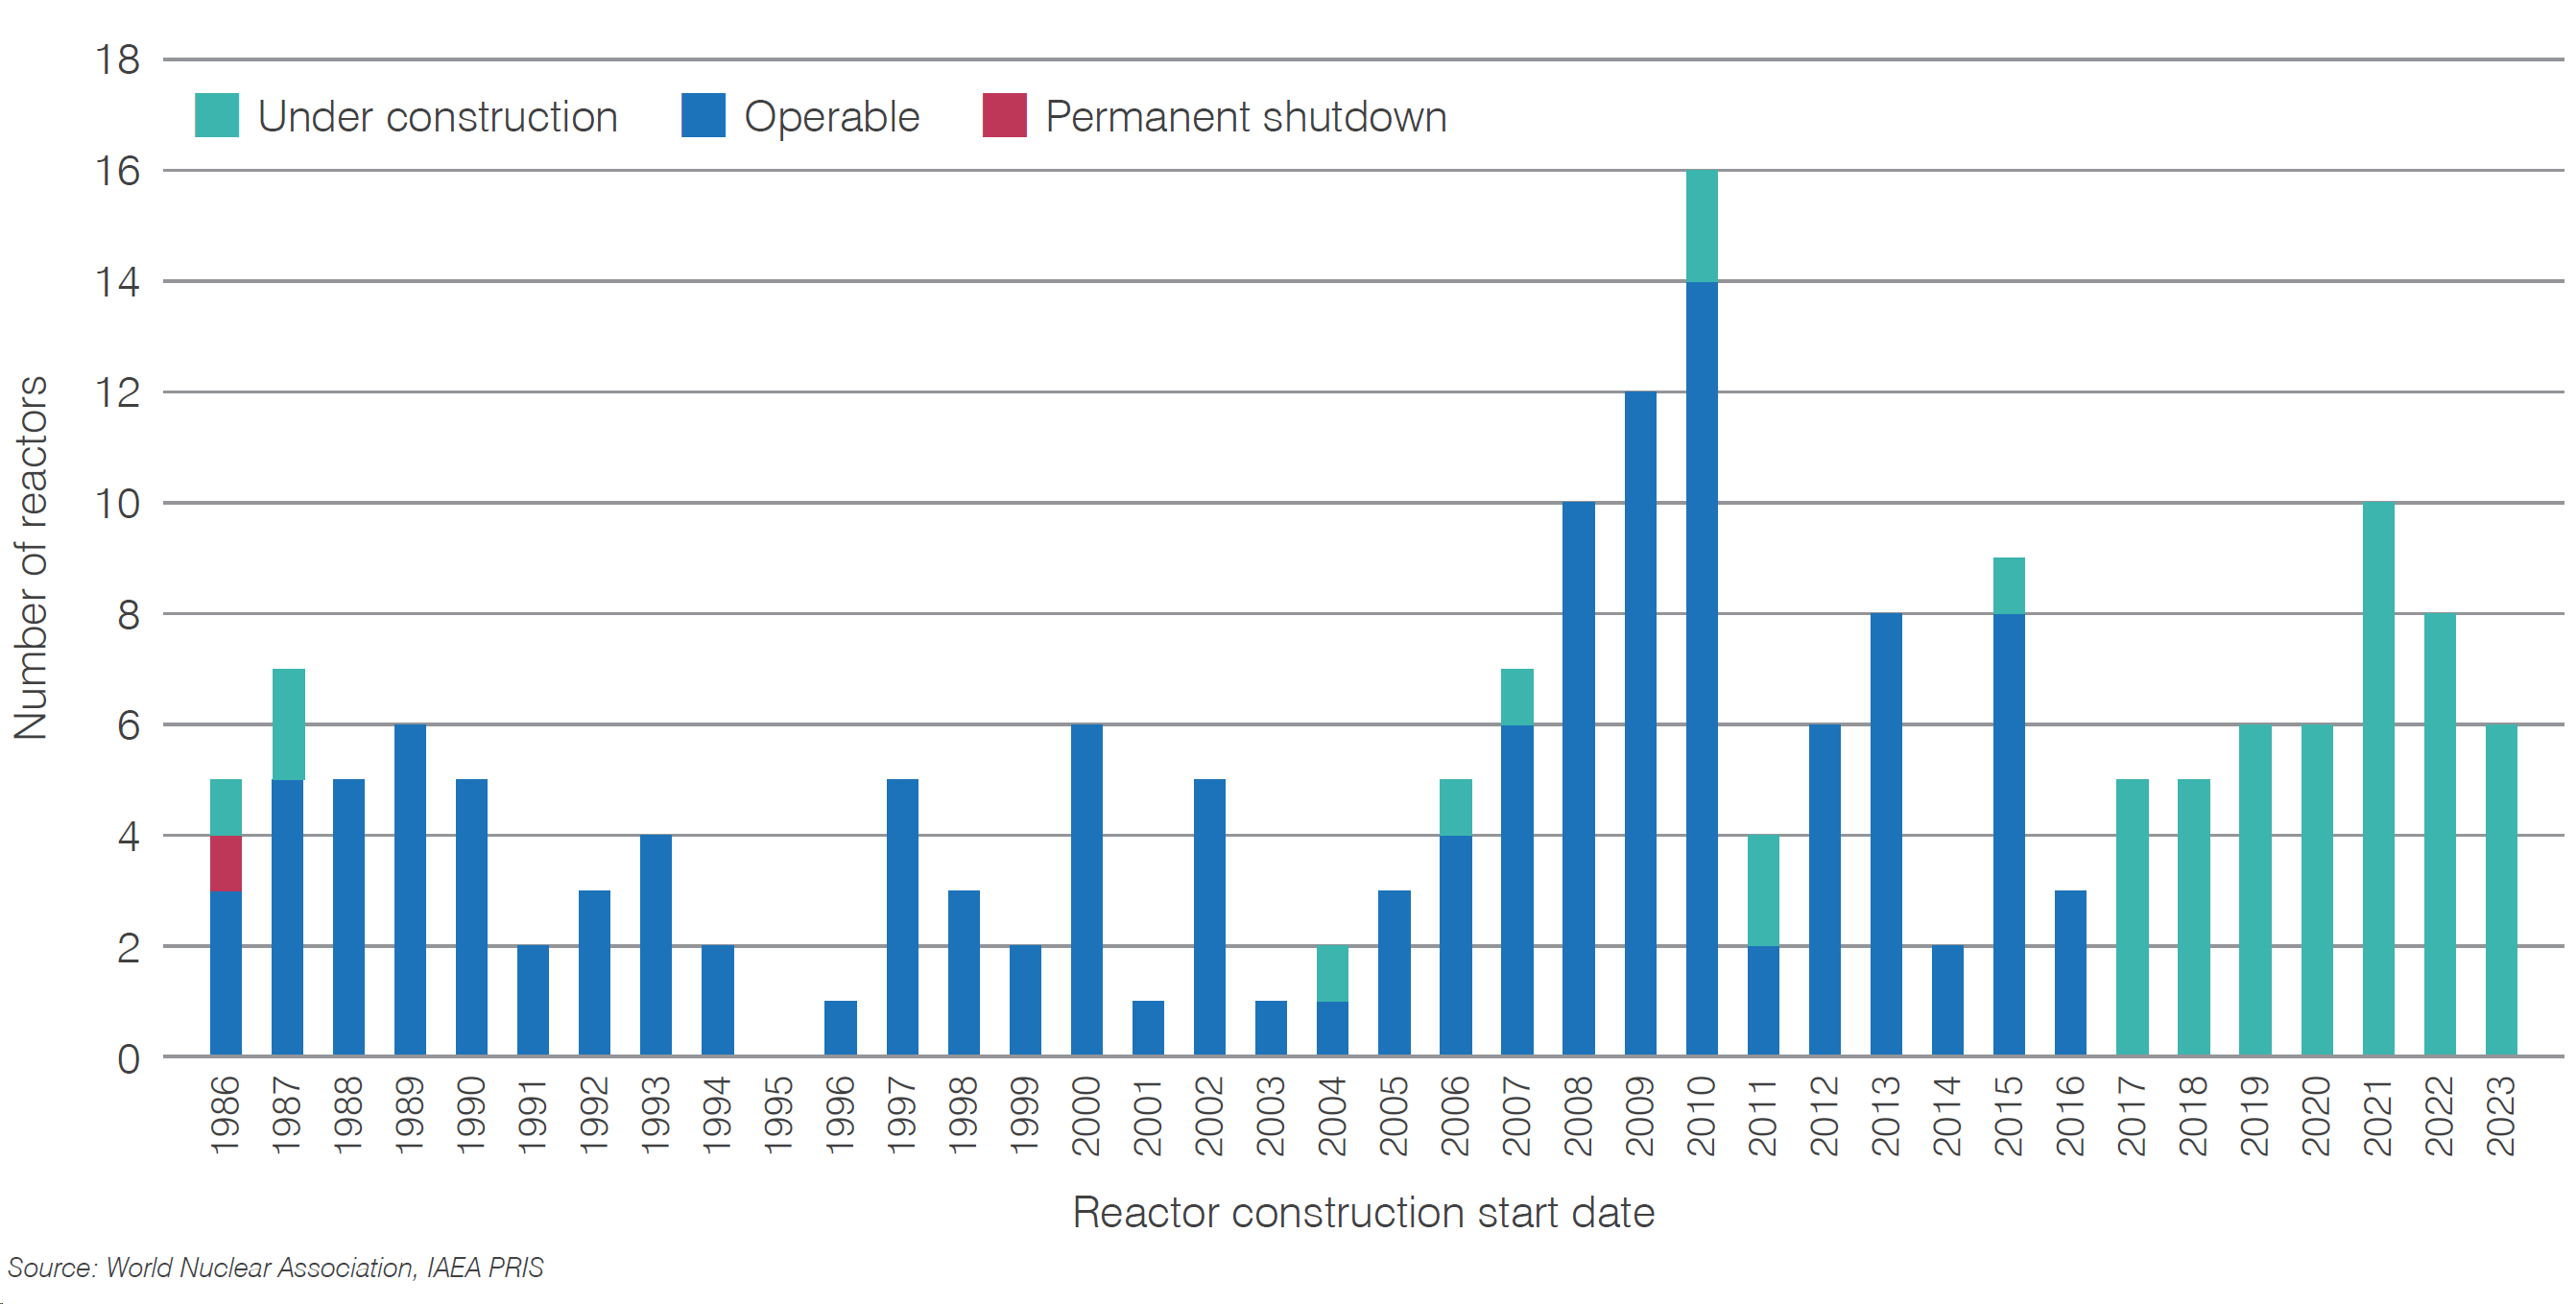
Most reactors under construction today started construction in the last seven years. The small number that have taken longer are either pilot plants, first-of-a-kind (FOAK) reactors, or projects where construction was suspended before being restarted. Construction on Khmelnitski 3&4, in Ukraine, started in 1986 and 1987, respectively, before being halted in 1990. In 2021 Energoatom signed an agreement with Westinghouse that might see completion of unit 4. In Slovakia, construction started in 1987 on Mochovce 3&4. Construction was halted in 1990, before recommencing in 2015. Mochovce 3 was connected to the grid in in January 2023, and work is continuing to bring unit 4 into service.
Figure 12. Operational status of reactors with construction starts since 1986
Reactor shutdowns
Five reactors were permanently shut down in 2023. These include the final three reactors operating in Germany, Kuosheng 2 in Taiwan, China, and Tihange 2 in Belgium, which were all shut down as part of phaseout policies.
Table 5. Shutdown reactors in 2023
| Location | Model | Process | Capacity (MWe) | Grid connection | Permanent shutdown | |
|---|---|---|---|---|---|---|
| Tihange 2 | Belgium | WH 3-loop | PWR | 1008 | 13 October 1982 | 1 February 2023 |
| Kuosheng 2 | Taiwan, China | BWR-6 | BWR | 985 | 29 June 1982 | 14 March 2023 |
| Emsland | Germany | Konvoi | PWR | 1335 | 19 April 1988 | 15 April 2023 |
| Isar 2 | Germany | Konvoi | PWR | 1410 | 22 January 1988 | 15 April 2023 |
| Neckarwestheim 2 | Germany | Konvoi | PWR | 1310 | 3 January 1989 | 15 April 2023 |
Source: World Nuclear Association, IAEA PRIS
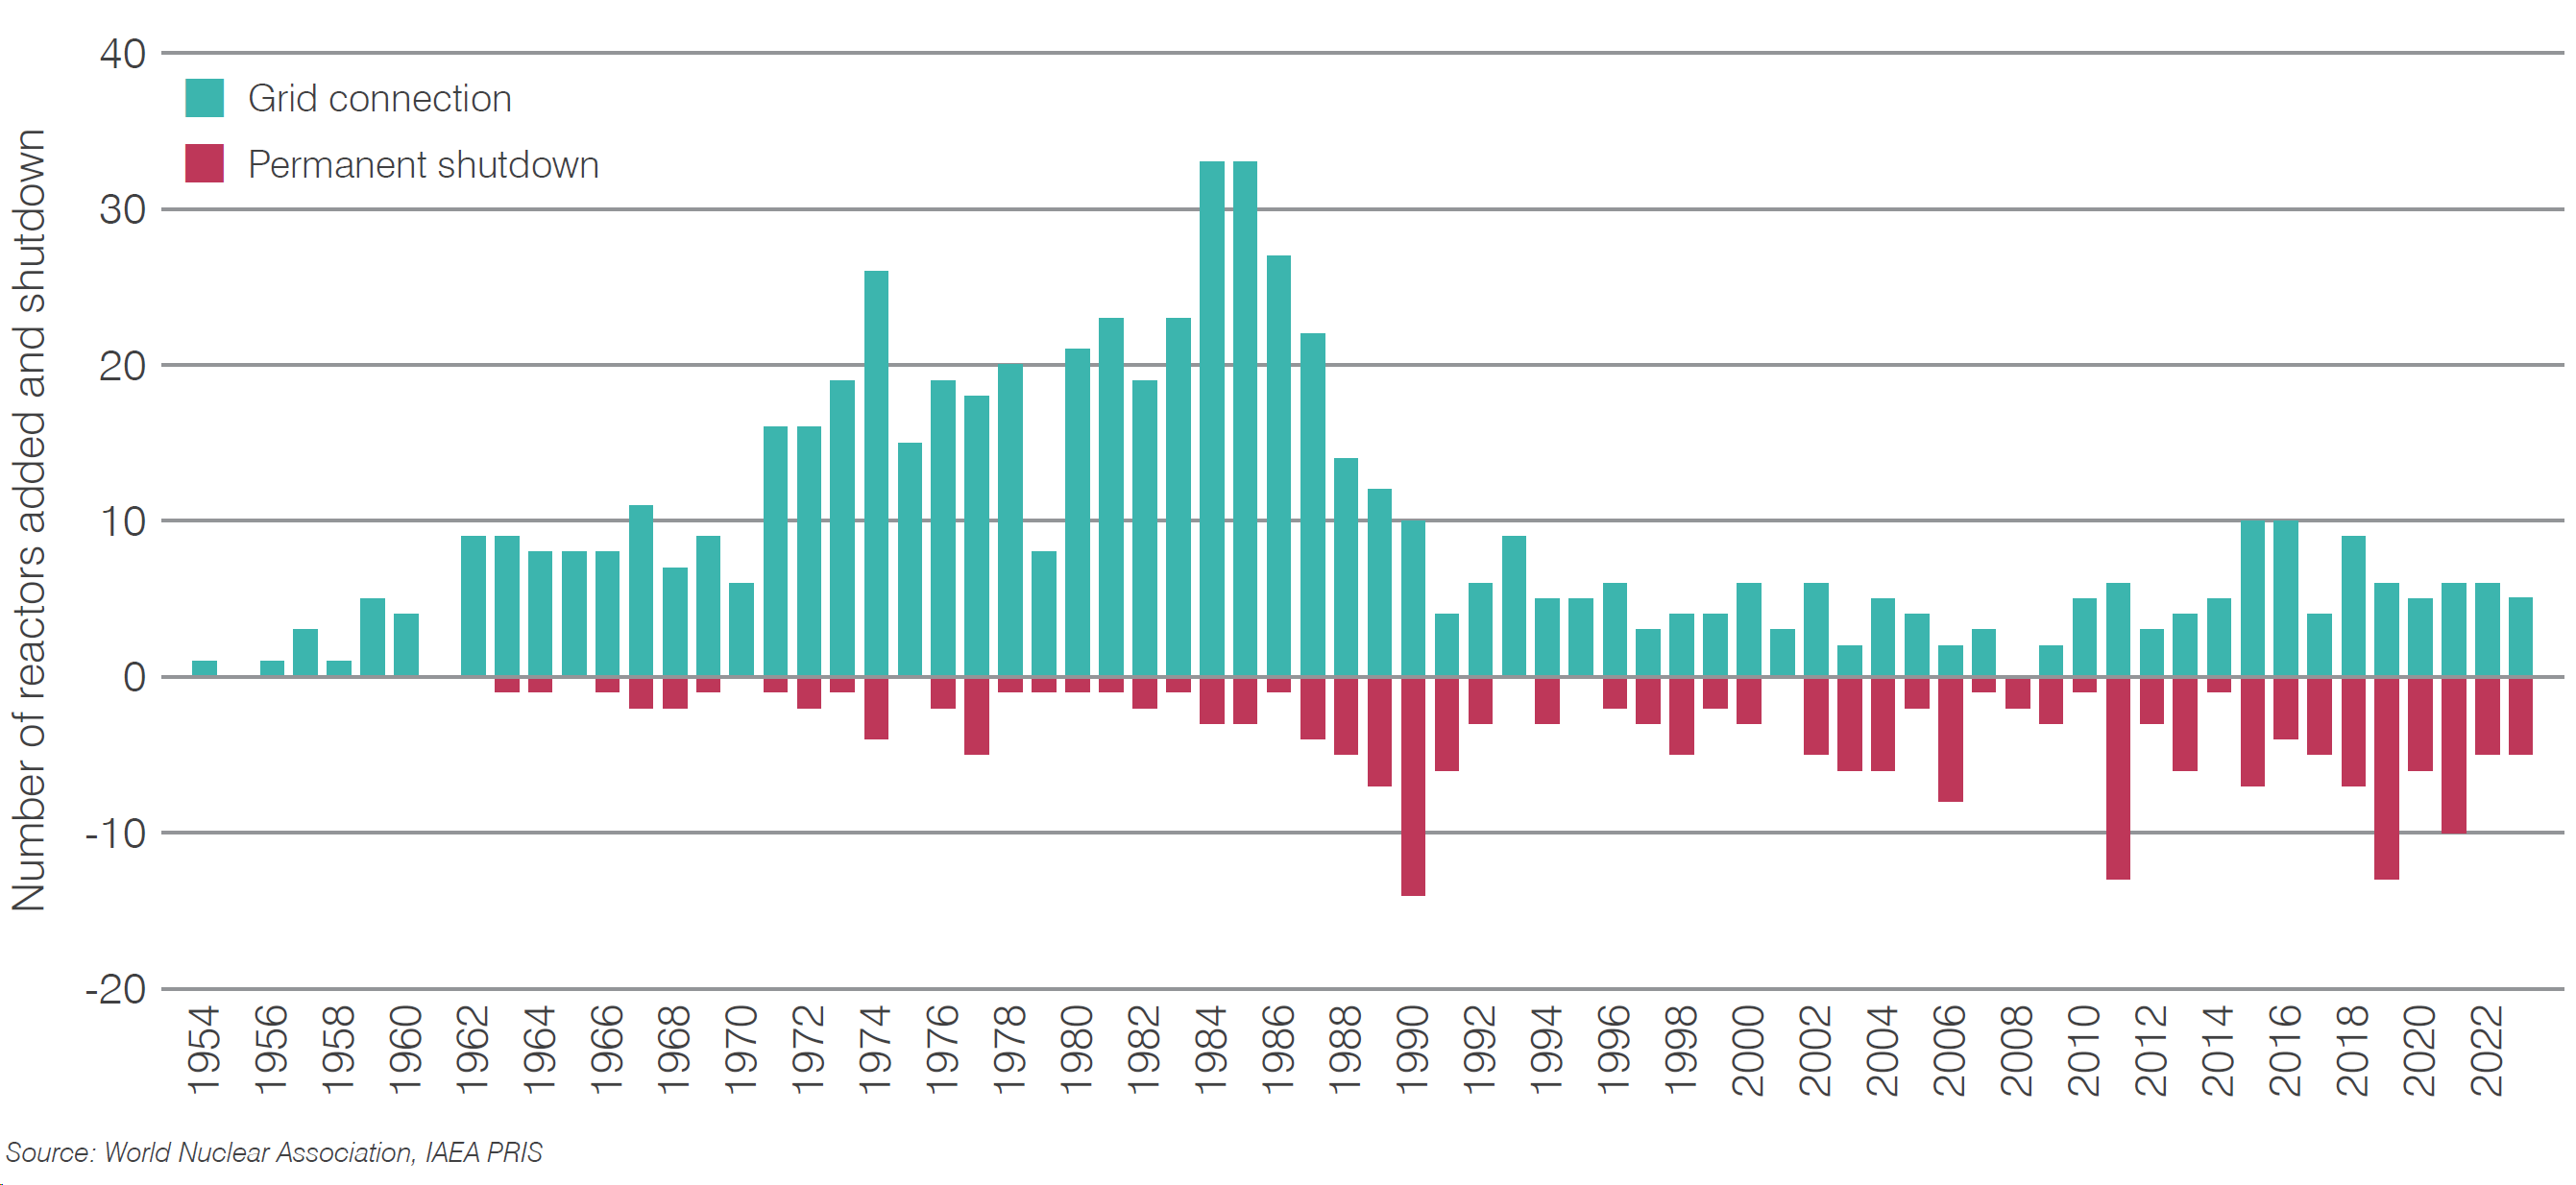
In 2023 as five reactors closed and five were grid connected, there was no net change in the number of operable reactors worldwide.
Figure 13. Reactor first grid connection and shutdown 1954-2023